When items exhibit different difficulties for different person groups this is called "item bias" or "differential item functioning", DIF. When the DIF is the same for all ability levels of the two groups this is termed Uniform DIF. Table 30 reports this. When DIF differs with ability levels, this is termed Non-Uniform DIF, NUDIF. This is discussed here. Non-uniform DIF is also called Differential Score Functioning or Differential Step Functioning (DSF).
Non-uniform DIF is difficult to interpret. Please start by looking at
Graphs Menu. Non-uniform DIF ICCs.
This will show you which items have an interaction between item difficulty, group membership and ability.
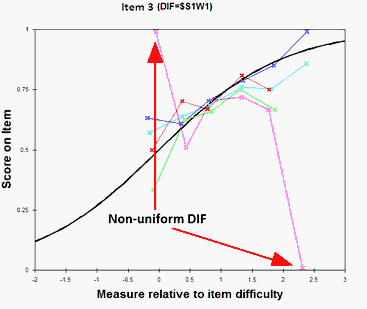
If you see an item for which the item difficulty is noticeably different for high and low performers in a group, then Table 30.1 will report the statistical significance of the difference.
DIF class specification is: DIF=$S1W1+MA2
------------------------------------------------------------------------------------------------------------------------------------
| Examinee Obs-Exp DIF DIF Examinee Obs-Exp DIF DIF DIF JOINT Welch Mantel-Haenszel Size Item |
| CLASS Average MEASURE S.E. CLASS Average MEASURE S.E. CONTRAST S.E. t d.f. Prob. Chi-squ Prob. CUMLOR Number Name |
|----------------------------------------------------------------------------------------------------------------------------------|
| 21 .00 -.1950 .1151 22 -.13 .5092 .1836 -.7042 .2166 -3.25 300 .0013 .0000 1.000 3 1 |
Conceptually, all DIF is non-uniform. "Uniform DIF" = "Average non-uniform DIF". For instance, in the Mantel-Haenszel DIF computation, every raw-score stratification reports a different DIF estimate. The Mantel-Haenszel statistic averages these estimates. Winsteps reports uniform DIF as a summary of a non-uniform DIF distribution in the same way that the mean is a summary of a sample distribution.
1) Look at the empirical ICC (Graphs menu, Non-uniform DIF). Is the empirical ICC clearly flatter or steeper than the model ICC for a classification group? Suppose that is group F
2) In the Winsteps DIF table 30.1, we expect F1 vs. F2 to be both a large DIF contrast (>1.0 logits) and to be statistically significant (p≤.05).
3) There should be a substantive reason for deciding that the NUDIF is not merely a statistical accident.
Example, the division sign, ÷, is very difficult for those students who have not learned its meaning, and easy for those who have. So it exhibits NUDIF across grade-levels.
In detail:
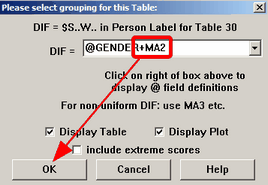
1. Simple NUDIF reporting. In Table 30, specify both a person class column with DIF= and the number of ability strata to be reported, e.g., $MA2, which reports 2 levels of ability, the top and bottom half of the ability range. Here is the dialog box:
Here is the plot:
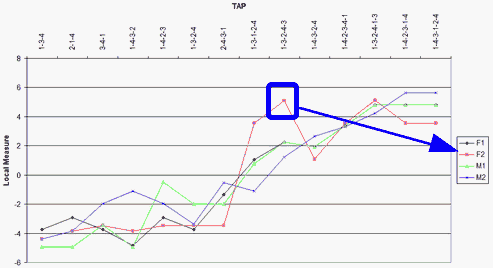
The blue box flags an example of non-uniform DIF. It is"F2" where "F" (@GENDER) is the females, and "2" (MA2) the upper ability group. "F1" is "F' ability group "1", the lower ability group. The non-uniform DIF numbers are shown in Table 30.2:
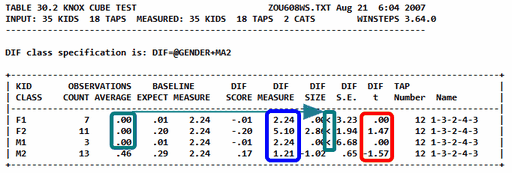
Some person classes have extreme scores. These are shown in the green boxes, and are indicated by "<" for minimum extreme scores and ">" for maximum extreme scores. The plotted DIF measures are shown in the blue box, with the DIF size relative to the overall item difficulty level in the adjacent column.
Table 30.1 reports if there is pairwise DIF between CLASSES/GROUPS.
2. For more insights, plot the non-uniform DIF ICCs.
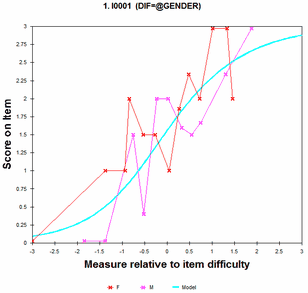
Example: I would like to study each item for any differences of skewness of responses between male and female respondents. How do I do that in Winsteps?
Try the approaches above, you can also try this:
a) analyze your data together. Output person measures: PFILE=pf.txt
b) transpose the data: TRPOFILE=
the persons are now the columns and the items are the rows.
c) in the transposed control file:
ISGROUPS=* (or in a separate file)
1 M (gender of person 1)
2 F (gender of person 2)
3 ...
....
*
d) anchor the persons at their PFILE measures, as items:
IAFILE= pf.txt
USCALE=-1 (convert person ability to item difficulty)
e) analyze the transposed data one item at a time: IDELETE=+23 (number of the target item)
f) the output will have two rating scales, one for each gender, in Table 3.2 and the Graphs window.
g) you can display the two ICCS simultaneously: Multiple Item ICCs
try with both "relative x-axis" and "absolute x-axis" to see which draws the clearest picture.
