Produces a 3-dimensional scatterplot using R Statistics.
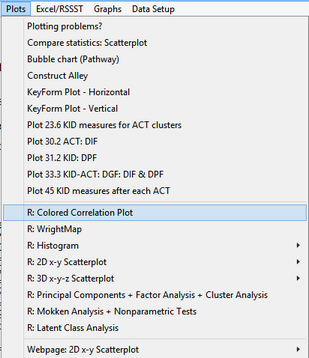
1.Install R-Statistics (once only) 2.Run the Facets analysis. 3.Output Tables and Plots pull-down menu 4.Click on the 3D Scatterplot 5.Click on the Output File containing the 3 columns of numbers you want to scatterplot 6.3D Scatterplot Control dialog box displays
7.Choose the variables for the x-, y- and z-axis values 8.Select Color cluster? and choose Colored? points. 9.Make other changes (if any) 10.Click on '3D Scatterplot" button 11.R Statistics launches 12.3D Scatterplot displays. |
|
3D Scatterplot Control |
scatterplot3d instruction |
Meaning |
Default: |
Plotting values from: |
scatterplot3d (xyz, xyz is generated from a Winsteps output File. |
Input file containing 3 columns of numbers |
SCOREFILE= score and measure file |
x-axis values |
first column in xyz |
values on x-axis |
column 1 in output file |
y-axis values |
second column in xyz |
values on y-axis |
column 2 in output file |
z-axis values |
third column in xyz |
values on z-axis |
column 3 in output file |
Color cluster? |
color= |
use values to construct colored clusters of points |
yes |
Top title: |
main= |
title above scatterplot. |
|
Bottom title |
sub= |
title beneath scatterplot |
name of Output file |
x-axis title |
xlab= |
label for x-axis |
title of x-value column |
y-axis title |
yab= |
label for y-axis |
title of y-value column |
z-axis title |
zlab= |
label for z-axis |
title of z-value column |
Type of plot: Points, Lines, Points and lines, Vertical lines |
type= |
how the points are displayed on the plot |
Points |
Draw axes? |
axis= |
are the x-, y-, z- axes shown |
Yes |
Show tick marks? |
tick.marks= |
are the tick marks shown on the axes? |
Yes |
Labels tick marks? |
label.tick.marks= |
do the tick marks have numerical labels? |
Yes |
Highlight 3D? |
highlight.3d= |
some points emphasized in black |
No |
Show grid? |
grid= |
gridlines shown on x, z axis plane |
Yes |
Box around plot? |
box= |
enclose plotted points in a box? |
Yes |
Scale of y-axis |
scale.y= |
scale of y-axis relative to x-axis |
set by software |
y-label padding |
y.margin.add= |
extra gap between y-axis label and y-axis |
set by software |
Colored? points |
color= |
up to 4 colors for 4 clusters of points. For black: Set: Greys Color number: 9 |
Set 1, colors 1, 5, 7, 8 |
Colored? axes, grid, labels |
col.axis=m col.grid=, col.lab= |
color to use when displaying these elements. If blank, the color is black. |
Set 1, colors 2, 3, 4 |
Set: |
|
range of colors for Colored? Some palettes are shown. For all, type at the R prompt: > display.brewer.all() |
Set1. Colors in each set are numbered from 1 onwards. |
Font type: axis, label |
font.axis=, font.grid=
|
font style on for axis labels and other labels |
Plain |
Plain, Italic, Bold, Bold Italic |
values for font.axis=, font.grid= |
font style on plot |
Plain |
Point symbol |
pch= |
symbol ot use for plotted points |
1, small circle |
Magnification: Point symbols, Axis annotation, Labels |
cex.symbol=, cex.axis=, cex.lab= |
change size of symbols and letters |
set by software |
Line-type: Axis, Grid, Hidden, Vertical |
lty.axis=, lty.grid=, lty.hide=, lty.hplot= |
format of plotted lines |
solid |
Solid, Dashed, Dotted, Dotdash, Longdash, Twodash, None |
available line options |
formatted of plotted lines. None = no line shown |
solid |
3D Scatterplot |
launch R statistics: scatterplot3d |
3D x-y-z scatterplot is displayed |
library(scatterplot3d) > scatterplot3d(... |
Exit |
current dialog box setting are saved and dialog box is closed |
||
Cancel |
dialog box is closed. Setting of most recent displayed scatter box are saved. |
||
Reset to defaults |
all values are reset to their default values |
settings are reset to default values when Winsteps is launched |


