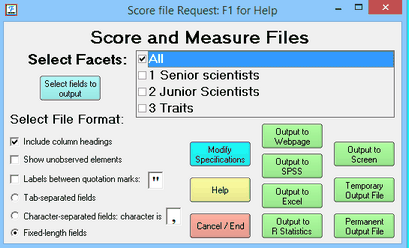
From the Output Files menu as Score and measure file output. This enables you to control the Score and measure file. Score and measure output files simplify the transfer of measures to other computer software. you may specify a file name that will be used to construct files to hold the numeric results presented in Facets measure tables. Also produced by Scorefile=.
Output to SPSS, Excel and R Statistics are in their native-format. Excel and R Statistics are launched.
The measures for each facet are written to a separate file, whose name is that specified, with the facet number appended. E.g., if Scorefile=Results, then the measures for facet 1 are written to Results.1, for facet 2 to Results.2 etc.
For Excel-formatted output files, the scores and measures for the elements of each facet are written to separate workbooks.
For SPSS-formatted output files, the scores and measures for the elements of all facets are written to one SPSS .sav file, which includes facet number as a variable.
For R Statistics-formatted output files, the scores and measures for the elements of each facet are written to a separate Rdata file.

For help with this dialog box, see Output Dialog Box.
Select Facets: |
specifies the facets for which the elements are to be reported. |
Select file format: |
describes in what way you want the details of each element to be listed |
Include column headings |
Usually headings are not wanted when a score file is to be imported into a database. Heading lines= |
Show unobserved elements |
Reports all elements specified in Labels=. Otherwise only elements active in this analysis are reported. Omit-unobserved= |
Labels between quotation marks |
Useful if labels contain blanks. Required by some software. The quotation mark character can be specified |
Tab-separated fields |
best field format for Excel |
Character-separated fields |
best field format for some database programs. The separator character can be specified |
Fixed-length fields |
easiest field format to read by eye |
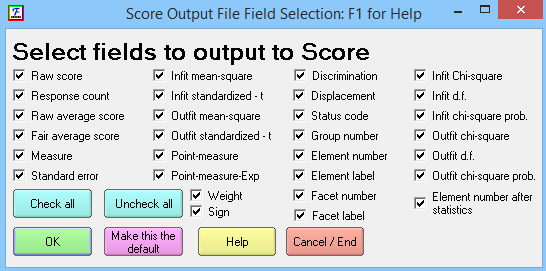
to select which fields to include in the score file. Check the fields to be output. Then click on OK.
When Element number is checked, its place in the Score file is set by "Element number after statistics" When "Element number after statistics" is checked, the Element number is placed after the numerical statistics and before the Element label in the output data line. When "Element number after statistics" is not checked, the Element number is placed first in the output data line. |
|
(Other Buttons) |
see Output Dialog box. |
Example: Write out score files for each facet in fixed field format:
Score file= kct
This puts the measures for facet 1 in file "kct.1.txt", for facet 2 in "kct.2.txt", etc. The results depend on the score file field selection, but can be:
1 |
Children |
|
|
|
|
|
|
|
|
|
|
|
|
|
|
|
|
|
|
T.Score |
T.Count |
Obs.Avge |
FairMAvge |
Measure |
S.E. |
InfitMS |
InfitZ |
OutfitMS |
OutfitZ |
PtMea |
PtMeExp |
Discrim |
Displace |
Status |
Group |
1 |
Children |
F-Number |
F-label |
7 |
18 |
0.29 |
0.05 |
-0.96 |
0.83 |
0.61 |
-1.19 |
0.29 |
1.99 |
0.8 |
0.75 |
1.71 |
-0.03 |
-1 |
-1 |
1 |
Boy |
1 |
Children |
10 |
18 |
0.5 |
0.43 |
1.74 |
1.11 |
4.1 |
2.47 |
6.15 |
1.94 |
0.65 |
0.87 |
-0.96 |
0 |
-1 |
-1 |
2 |
Boy |
1 |
Children |
The fixed field format is:
Field |
Columns |
Notes |
0. Element number |
241-250 |
Element number is the first field when "Element number after statistics" is not checked in the Score File Field Selection dialog box. Otherwise it is before the Element label. |
1. Raw score |
1-10 |
T.Score includes extreme scores, when Totalscore=Yes Score excludes extreme scores, when Totalscore=No |
2. Response count |
11-20 |
T.Count includes extreme scores, when Totalscore=Yes Count excludes extreme scores, when Totalscore=No Elements with no observations are omitted unless Omit-unobserved=No |
3. Observed average score |
21-30 |
(Raw Score)/(Raw Count) |
4. Fair average score |
31-40 |
FairMAvge: Fair=Mean computes from the mean of the other facets FairZAvge: Fair=Zero computes from the local zero of the other facets |
5. Measure |
41-50 |
Decimal places set with Umean=x,x,x |
6. Standard error |
51-60 |
Decimal places set with Umean=x,x,x |
7. Infit mean-square |
61-70 |
|
8. Infit standardized |
71-80 |
|
9. Outfit mean-square |
81-90 |
|
10. Outfit standardized |
91-100 |
|
11. Point-measure correlation |
101-110 |
or Point-biserial correlation. See Pt-biserial= |
12. Point-measure expectation |
111-120 |
.00 if not computed. |
13. Discrimination |
121-130 |
|
14. Displacement |
131-140 |
Decimal places set with Umean=x,x,x. This is limited to the range -10 to +10 logits. |
15. Status code |
141-150 |
See Status Code list below |
16. Group number |
151-160 |
|
17. Weight |
161-170 |
|
18. Sign |
171-180 |
|
19. Infit Chi-squared |
181-190 |
= infit information-weighted mean-square * d.f. |
20. Infit Chi-squared d.f. |
191-200 |
|
21. Infit Chi-squared 2-sided probability |
201-210 |
2-sided probability of the chi-squared value. <.05 is significant underfit or overfit. |
22. Outfit Chi-squared |
211-220 |
= outfit conventional mean-square * d.f. |
23. Outfit Chi-squared d.f. |
221-230 |
|
24. Outfit Chi-squared 2-sided probability |
231-240 |
2-sided probability of the chi-squared value. <.05 is significant underfit or overfit. |
25. Element number |
241-250 |
Element number is here when "Element number after statistics" is checked in the Score File Field Selection dialog box. Otherwise it is the first field. |
26. Element label |
251- ? |
field length depends on the length of the element labels |
27. Facet number |
10 columns |
field positions depends on the length of the element labels |
28. Facet label |
? |
field length depends on the length of the facet label |
Status code |
Meaning for element measure |
1 |
Anchored measure |
0 |
No data available to estimate measure |
-1 |
Measure estimated from data |
-2 |
Measure estimated for extreme low score: XTREME= |
-3 |
Measure estimated for extreme high score: XTREME= |
-4 |
Unmeasurable, because all relevant data are generated by more than one extreme element |
-5 |
Only one active data point for this element |

