Uses R Statistics to perform the nonparametric analysis described in mokken.pdf and eRm-NPtest.
Please Google "introduction to Mokken analysis" for Mokken-analysis instructions. Please tell mike@winsteps.com which instructions are the best for you. Here is a video: Running a Mokken scaling analysis
Wind, S.A. (2014) Examining rating scales using Rasch and Mokken models for rater-mediated assessments
Journal of Applied Measurement 15(2):100-32. Link
van der Ark, L. A. . (2012). New Developments in Mokken Scale Analysis in R. Journal of Statistical Software, 48(5), 1–27. Link
Ponocny, I. (2002) Nonparametric goodness-of-fit tests for the Rasch model. Psychometrika 67(2):315-315. Link
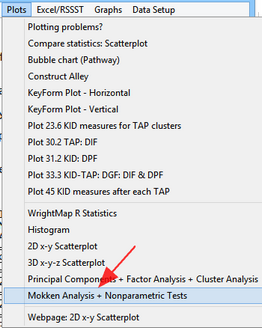
From the Plots menu:


Option |
Description |
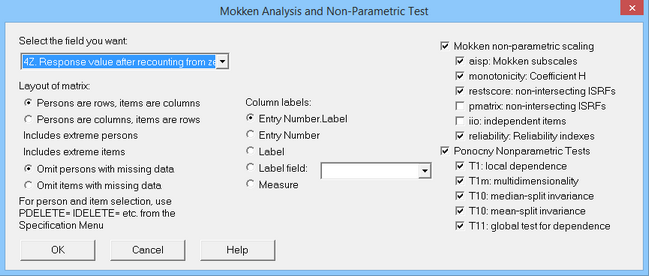
Select field: 4Z. Response value after recounting from zero |
Nonparametric analysis requires simple ordinal data. |
Persons are rows, items are columns Persons are columns, items are rows |
The columns are treated as items (variables) in this analysis. |
Omit persons with missing data Omit items with missing data |
Missing data is not allowed |
Column labels |
shown in reports and plot headings |
Mokken Nonparametric Scaling (dichotomous or polytomous data) |
Mokken tests Loevinger's Coefficient H reported as ItemH ISRF: item-step response function IIO: invariant item ordering |
Ponocny Nonparametric Tests (dichotomous data only) |
Ordinal tests of dependence and invariance |
There are more nonparametric tests available from the R Statistics > prompt, e.g., T1l (learning) |
See mokken.pdf and eRm-NPtest. |
Output from R Statistics:
[1] "Mokken Scaling (R Statistics package: mokken)"
[1] "Mokken-consistent Subscales: aisp"
[1] "subscales numbered 1 and up. 0 = not in subscale"
0.3
X4.1.3.4 1
X5.2.1.4 1
.....
[1] "Ponocny Nonparametric Tests only for dichotomous data (R Statistics package: eRm)"
[1] "Local dependence = overfit (T1)"
.....
[1] "available Mokken plots:"
[1] "plot(monotonicity.list)"
[1] "plot(restscore.list)"
[1] "plot(pmatrix.list)"
[1] "plot(iio.list)"
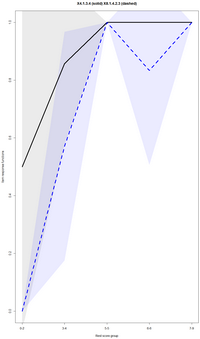
Plots are usually many pages (R Statistics windows) requiring one click for each page. Escape key and window ☒ to exit.
> plot(iio.list)
