Uses R Statistics to perform Latent Class Analysis (LCA) described in poLCA.pdf
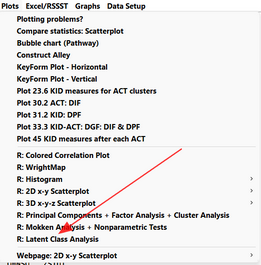
From the Plots menu:


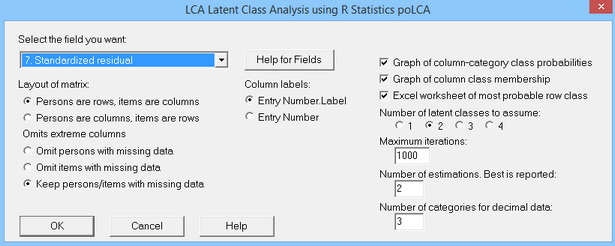
Option |
Description |
Select field: 7. Standardized Score Residual |
Numerical data accepted. |
Persons are rows, items are columns Persons are columns, items are rows |
The columns are treated as items (variables) in this analysis. |
Omit persons with missing data Omit items with missing data Keep persons/items with missing data |
Missing data is allowed |
Column labels |
in R Statistics "data" dataframe and output |
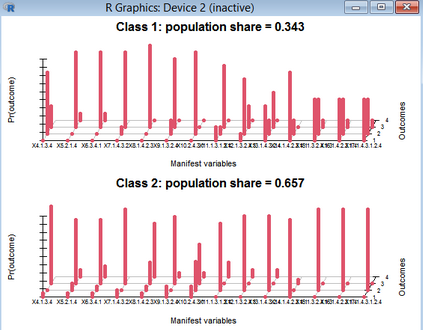
Graph of column-category class probabilities |
Item data is stratified into categories. The categories are analyzed as nominal, not ordinal. Each category of each item is reported with a probability for each class |
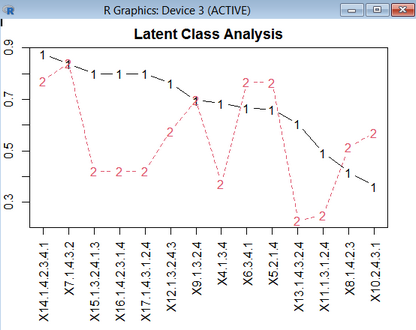
Graph of column class membership |
The category probabilities are summarized by column |
Excel worksheet of most probable row class |
The most probable row for each row is reported together with the person PFILE= or item IFILE= data by Excel |
Number of latent classes to assume |
"1" reports the log-linear independence model "2", "3", "4" report latent classes |
Maximum iterations |
poLCA usually requires only a few iterations |
Number of estimations. Best is reported. |
Starting values are random. Multiple estimations guard against false estimates. |
Number of categories for decimal data |
Data are stratified into categories, which are treated as nominal. |
Output from R Statistics:
Model 1: llik = -1014.741 ... best llik = -1014.741
Model 2: llik = -988.4622 ... best llik = -988.4622
Conditional item response (column) probabilities,
by outcome variable, for each class (row)
$X4.1.3.4
Pr(1) Pr(2) Pr(3)
class 1: 0.0000 0.75 0.2500
class 2: 0.0435 0.00 0.9565
.....
$X17.1.4.3.1.2.4
Pr(1) Pr(2) Pr(3)
class 1: 0.5 0.4167 0.0833
class 2: 0.0 1.0000 0.0000
Estimated class population shares
0.3429 0.6571
Predicted class memberships (by modal posterior prob.)
0.3429 0.6571
=========================================================
Fit for 2 latent classes:
=========================================================
number of observations: 140
number of estimated parameters: 73
residual degrees of freedom: 67
maximum log-likelihood: -988.4622
AIC(2): 2122.924
BIC(2): 2337.664
G^2(2): 1161.126 (Likelihood ratio/deviance statistic)
X^2(2): 8334110 (Chi-square goodness of fit)
summary of column class probabilities
[,1] [,2]
X14.1.4.2.3.4.1 0.8757764 0.7714286
...
X10.2.4.3.1 0.3614907 0.5714286
Graphs:


Excel worksheet:
