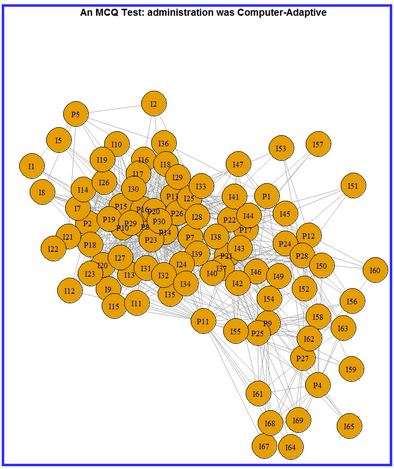
The R Statistics package "igraph" displays the network of connections between persons and items. This shows the number of connections between items and persons and also identifies disconnected subsets of persons and items. The network is based on the data. Anchoring and missing data are ignored.
From the Plots menu:
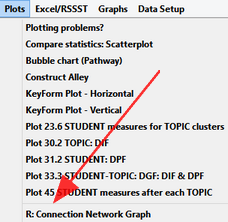
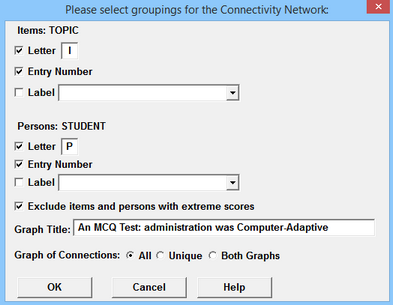
Connection Network dialog box:
 :
:
Connectivity Network Dialog Box |
|
Items: |
Columns in the data |
Persons: |
Rows in the data |
Letter: |
.One letter to identify items or persons in the graph |
Entry number |
Is the item or persons entry number to be shown on the graph? |
Label |
Is the item or person label (or part of it) to be shown on the graph? |
Exclude items and persons with extreme scores |
Items and persons with maximum possible and minimum possible scores are not used for connecting subsets |
Graph title: |
Wording at the top of the graph |
Graph of Connections |
All: all connections between elements in the data Unique: only one connection shown between elements in the data Both Graphs: All and Unique graphs |
OK |
display the "igraph" network graphs |
Cancel/End |
exit |
Help |
this page |
Example from Exam5.txt: multiple-choice computer-adaptive test.
Example with Subsets.