Winsteps enhancements, changes and bug-fixes

Winsteps now does CMLE and JMLE !!

Winsteps Rasch software: update history

Winsteps has transitioned from 32-bit to 64-bit Windows software
Winsteps/Ministep 5 (2021 onwards) runs on Windows 11, 10, 8.1 with complete functionality.
Winsteps 5 does not run on Windows 8, 7, Vista, XP and earlier. Please request Winsteps/Ministep 4.8.2.
Winsteps 5 (64-bit) and Winsteps 4.8 (32-bit) produce the same JMLE output in the same amount of time.
Mac, Linux,Chrome OS: Winsteps is 64-bit Windows software.
For complete functionality, please Google how to run 64-bit Windows software on your computer.

For trouble-shooting when installing Winsteps, see problems.htm.

Update procedure: When an update is released, all license holders are notified by email. For those eligible for free updates (within one year of original purchase or two years of renewal), the email contains an update download URL and an installation password. All licensees receive at least one free update. To request updates, report bugs, and make suggestions, please email mike@winsteps.com.

Winsteps 5.8.3 November 2024; 5.8.2 October 2024; 5.8.1 September 2024; 5.8.0 July 2024
    Improvements and bug-fixes:
  • 5.8.3 Bug fix: crash when R Statistics launched, but is not installed.
  • 5.8.3 Enhancement: data line starting with ; is skipped as a comment
  • 5.8.3 Enhancement: CIMPUTE= PCA with missing data imputed or not: https://www.sciencedirect.com/science/article/pii/S1574954121000261
  • 5.8.2 Enhancement: Tables 23.0, 24.0 Dimensionality: reports "Essential Unidimensionality %"
  • 5.8.2 Bug fix: Tables 30, 31, 33 DIF, DPF, DGF: small DIF values with large samples were not shown in Tables
     
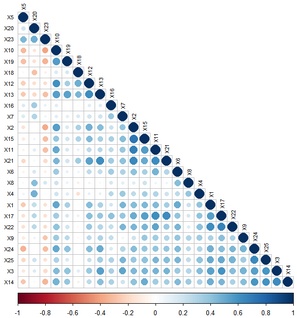
  • 5.8.1 Enhancement: colorful correlation matrix using R Statistics package "corrplot"
  • 5.8.1 Enhancement: Edit menu: Edit Initial Settings: change font for Winsteps menus
  • 5.8.1 Bug fix: Model=C and Table 3.2: "Method of Successive Dichotomies" estimation and reporting corrected
  • 5.8.0 Enhancement: Plots menu: Latent Class Analysis with R Statistics package poLCA
  • 5.8.0 Enhancement: Table 20 and SCOREFILE=: when TOTALSCORE=YES, items with extreme scores are included in the score-to-measure table
  • 5.8.0 Bug fix: Table 20.2: corrected UIMEAN= and USCALE= to match the Normed person measure output
  • 5.8.0 Bug fix: Batch file reports error on invalid batch command line
  • 5.8.0 Bug fix: Error message now when DIF variables are outside person label
  • 5.8.0 Bug fix: Excel/RSSST dialog box: allows editing of control and data files
  • 5.8.0 Bug fix: Output Files menu: IPMATRIX=: corrected column heading for R Statistics files
  • 5.8.0 Bug fix: Output Files menu: correct naming of Transposed and Facets-formatted files
  • 5.8.0 Bug fix: Graph menu dialog box (32-bit): corrected curve names in R Statistics plot
  • 5.8.0 Bug fix: Table 2 formatting error when LINELENGTH=0 (very wide, e.g., Example file: Exam11.txt)
Winsteps-R Colored Correlation Plot
 
Colored Correlation Plot
Winsteps 5.7.4 June 2024; 5.7.3 May 2024; 5.7.2 April 2024; 5.7.1 February 2024; 5.7.0 January 2024
    Improvements and bug-fixes:
  • 5.7.4 Enhancement: Plots menu: Mokken Scaling Analysis and Ponocny Nonparametric Tests using R Statistics
  • 5.7.4 Change: Data Setup menu: 32-bit or 64-bit now options in Edit menu: Edit Initial Settings
  • 5.7.4 Bug fix: Excel/RSSST menu: 64-bit interface: occasional failure to read entire imported file
  • 5.7.4 Bug fix: Data Setup menu: 64-bit: some needed files not installed
  • 5.7.3 Enhancement: Excel/RSSST menu: input reformatter, now also 64-bit. Default is 32-bit: XLRSSST32=Yes
  • 5.7.3 Enhancement: Analysis window: warning message:"Estimation may have diverged. Press Ctrl-F to stop iterations."
  • 5.7.3 Bug fix: Output Files menu: Simulations: multiple permanent files now output correctly
  • 5.7.3 Bug fix: 64-bit scatter plot with Excel. Chart labels now "Identity" and "Empirical"
  • 5.7.3 Clarification: default output of SPSS .sav files is 32-bit: SPSS32=Yes
  • 5.7.2 Enhancement: Plots menu: Cluster Analysis with R package "pvclust"
  • 5.7.2 Enhancement: Output Files menu: IPMATRIX: option to only output persons/items with complete data
  • 5.7.2 Bug fix: Table 20 and SCFILE: percentiles now the same.
  • 5.7.2 Transition: more 32-bit support modules upgraded to 64-bit modules
     
  • 5.7.1 Enhancement: MODELS= now with "C" = consecutive dichotomous model - [Method of successive dichotomizations: Bradley, Massof (2018)]
  • 5.7.1 Enhancement: Plots menu: Webpage x-y plot: faster due to Winsteps.js file
  • 5.7.0 Enhancement: IPDECIMALS= sets decimal places reported in IFILE= and PFILE=
  • 5.7.0 Enhancement: T30PAIRSMAX= limits pair-wise DIF comparisons reported in Table 30.1, 31.1
Winsteps 5.6.4 November 2023; 5.6.3 October 2023; 5.6.2 September 2023; 5.6.1 August 2023; 5.6.0 July 2023
    Improvements and bug-fixes:
  • 5.6.4 Enhancement: MFORMS= warning if item column exceeds NI=
  • 5.6.4 Bug fix: Plots menu: R Statistics Wright Map window: crash when unselecting Left-side group statistics
  • 5.6.4 Bug fix: IDELQU= amd PDELQU= fail, but IDELETE= and PDELETE= at the Extra Specifications prompt is preferable.
  • 5.6.4 Bug fix: Graphs menu: crash selecting "Scales"
  • 5.6.3 Bug fix: Table 23.6 - corrected Reliabilities and Baseline measures when UMEAN= and USCALE= are active
  • 5.6.3 Bug fix: corrected Details in the Winsteps.exe right-click Properties window
  • 5.6.3 Documentation: Winsteps.com (Winsteps and Facets) Privacy Policy
  • 5.6.3 Bug fix: EDFILE= prettier reporting of progress in Analysis window.
  • 5.6.3 Bug fix: remove meaningless warning message about memory allocation with big files
  • 5.6.2 Enhancement: Control file: output files generated for all output file commands in Control file or at Extra Specifications prompt. For example at - Extra Specifications? TFILE=* ISELECT=A SCOREFILE=ascorefile.txt * - outputs ascorefile.txt after the main analysis completes.
  • 5.6.2 Adjustment: R Statistics .rdata output files in Control file or at Extra Specification promps are created but do not launch R Statistics user interface. R Statistics can be launched by clicking on the file name in the Edit menu.
  • 5.6.2 Enhancement: Table 23.6. Person measure columns for each cluster and for baseline (person measures from main analysis).
  • 5.6.2 Enhancement: Output File Specifications dialog box: IADD=Yes checkbox for GRFILE graphing file.
  • 5.6.1 Enhancement: IADD=Yes adds the item difficulty to the measures in the item-curves graph file: GRFILE=
  • 5.6.1 Enhancement: Output Files: GRFILE= output values have 4 decimal places
  • 5.6.0 Enhancement: Output Files menu: Output as sortable webtables displayed with your web browser
  • 5.6.0 Enhancement: PTBIS=Skip - point-biserial correlations not computed: speeds up processing
  • 5.6.0 Enhancement: Analysis window: faster analysis for large, sparse datasets.
  • 5.6.0 Bug fix: persons with extreme scores incorrectly flagged as non-extreme when items are anchored.
  • 5.6.0 Bug fix: DIF/DPF/DGF Tables 30, 31, 33: corrected status indicators: < (extreme maximum score in CLASS), > (extreme minimum score in CLASS), E (extreme core in main analysis)
  • 5.6.0 Bug fix: Plots menu: R statistics plots: aes_ warning message removed
Winsteps 5.5.1 June 2023, Winsteps 5.5.0 May 2023
    Improvements and bug-fixes:
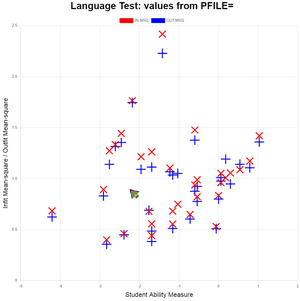
  • 5.5.1 Enhancement: Plots menu: interactive x-y scatterplot using your Webpage Browser: choose size, color and shape of markers. Plot 2 y-axis variables..
  • 5.5.1 Enhancement: Dimensionality Table 23.0 Table of contrast (PCA component) loadings
    List of Contrast Loadings
    -----------------------------------------------------------------------------------------------------------
    |  Entry          Outfit Infit   PTMA  Contrast (PCA Component) Loadings  ACT                             |
    | Number  Measure  Mean-square   Corr.    1      2      3      4      5   Label                           |
    |---------------------------------------------------------------------------------------------------------|
    |      1     -.40    .49   .55    .64   -.10    .15    .45   -.12    .58  Watch birds                     |
    |      2     -.71    .72   .93    .58   -.56   -.47    .14    .29   -.10  Read books on animals           |

  • 5.5.1 Bug fix: Tables 33.7, 33.8: printed output overwrites Editor path when there are many DGF classes.
  • 5.5.1 Bug fix: Graphs menu: Display by Scale Group: failure with message "mismatch at 10* l$"
  • 5.5.1 Bug fix: Plots menu: irrelevant warning messages for Excel-based plots
     
  • 5.5.0 Enhancement: Plots menu: interactive x-y scatterplot using your Webpage Browser.
  • 5.5.0 Bug fix: Output file ISFILE= Standard Errors corrected
  • 5.5.0 Technical change: Winsteps is written in FORTRAN, previously compiled with Absoft, now compiled with Intel IFORT and thoroughly tested, but if you see any malfunctions, please email a screenshot of the problem to mike@winsteps.com.
" Winsteps interactive x-y plot webpage"
Click on plot activate
Winsteps 5.4.3 April 2023, 5.4.2 March 2023, 5.4.1 February 2023, 5.4.0 January 2023
    Improvements and bug-fixes:
  • 5.4.3 Bug fix: Help menu: "About" entry correctly displayed.
  • 5.4.3 Bug fix: Rare crash computing Table 3.2 Confusion Matrix corrected.
  • 5.4.3 Bug fix: corrected: Output Table 36: output table split into folders and files by OFILE="c:\myfolder\"+@SCHOOL+"\"+@CLASS+".htm" (Please try downloading again, if you have problems with this.)
  • 5.4.3 Adjustment: allow more codes in EQFILE= and DIF Table 27 (and similar) Code Equivalence dialog box
  • 5.4.2 Enhancement: Output Table 36: output table split into folders and files by OFILE="c:\myfolder\"+@SCHOOL+"\"+@CLASS+".htm"
  • 5.4.2 Bug fix: Analysis window and Output Tables: occasional incorrect formatting of big numbers
  • 5.4.2 Bug fix: Output Files menu: IPMATRIX= incorrect output with missing data in file
  • 5.4.1 Enhancement: Close any Winsteps window from the Windows task bar using mouse right-click
  • 5.4.1 Enhancement: Plots menu: R statistics Wright Map, 2D scatterplot, 3D scatterplot: pull down lists of color palettes.
  • 5.4.1 Enhancement: Output Files format dialog box: Field selection button reinstated
  • 5.4.1 Bug fix: several hangs in dialog boxes
  • 5.4.1 Bug fix: Plots menu: R statistics Wright Map: infit sort order; column headings when items on left side
  • 5.4.1 Bug fix: Plots menu: R statistics 3D scatterplot: points-and-lines option corrected
  • 5.4.1 Bug fix: Winsteps-Excel interface: Compile error: type mismatch
  • 5.4.1 Bug fix: Data setup: nil object exception
  • 5.4.0 Simplification: Graphs menu: immediate display of Graph window choices (Standard, Enhanced) and options (by scale, by item, with DIF). Graphs Menu.
  • 5.4.0 Enhancement: in Enhanced Graph module: Customize Curves button enables curves to be removed from a graph and their colors changed. Customize Curves.
Winsteps 5.3.4 December 2022, 5.3.3 November 2022, 5.3.2 October 2022, 5.3.1 September 2022, 5.3.0 August 2022
    Improvements and bug-fixes:
  • 5.3.4 Enhancement: in Enhanced Graph module: Nonuniform DIF graph also includes Uniform DIF curve.
  • 5.3.4 Enhancement: in Enhanced Graph Window: button to change margin settings on graphs.
  • 5.3.4 Enhancement: Winsteps Graphs menu: more control over choice of Graphing module (Standard 32-bit, Bottom-right 32-bit or Enhanced 64-bit).
  • 5.3.3.1 Bug fix: display of 64-bit DIF curves
  • 5.3.3 Bug fix: Graph window: enhanced 64-bit winxojog.exe Winsteps graphing module - crash in "Test Randomness" plot
  • 5.3.3 Bug fix: Plots and other Excel functions: 32-bit "winexcel.exe" Winsteps-Interface actioned when possible, rather than 64-bit "winexcel.dat" interface.
  • 5.3.2 Bug fix: Excel 64-bit Interface: winexcel.dat - increased compatibility with 64-bit Microsoft Excel
  • 5.3.2 Bug fix: Data Setup window: 64-bit - failure on invalid pathname
  • 5.3.2 Enhancement: Edit Initial Settings, Graph Menu Display: Graphs Window 64-bit beta version, compatible with Windows 8.1 to Windows 11, and Windows on current Macs.
  • 5.3.1 Enhancement: T1MWE= mean and S.D. with/without extreme measures in Tables 1, 12, 16
  • 5.3.1 Adjustment: IPEXTREME= and T1MWE= define action for extreme scores on Tables 1, 12, 16.
  • 5.3.1 Bug fix: Formatting glitches in Tables 2, 3, 5, 20, 21, 23, 28, 29, 41, 44 and similar tables.
  • 5.3.1 Bug fix: Final "Closing" file dialog box: "No" now actioned
  • 5.3.0 Enhancement: Diagnosis menu and ESTMULT=: user control of size of changes to estimates after each iteration
  • 5.3.0 Enhancement: Table 36: PKMAPS: 1P=D locates all responses at their item difficulties. 0 in right-hand column, all others in left-hand column
  • 5.3.0 Enhancement: Example 18: demonstration of 64,000 items and 9,999,999 persons in a dataset
  • 5.3.0 Change: Table 23.1, 24.1: Contrasts always plotted as letters, not numbers.
  • 5.3.0 Bug fix: Table 6.6, 10.6: most unexpected responses, corrected
  • 5.3.0 Bug fix: Table 36: PKMAPS: polytomous responses positioning corrected
  • 5.3.0 Bug fix: Graphs window: (a) "Flip" corrected for cumulative probability curves. (b) y-axis range control corrected (c) Non-uniform DIF legend corrected
  • 5.3.0 Bug fix: Sometimes unresponsive after dialog boxes
  • 5.3.0 Bug fix: Unexpected font changes in Analysis window
Winsteps 5.2.5 July 2022; 5.2.4 June 2022; 5.2.3 May 2022; 5.2.2 March 2022; 5.2.1 February 2022; 5.2.0 January 2022
    Improvements and bug-fixes:
  • 5.2.5.2 Bug fix: Unresponsive message boxes
  • 5.2.5.1 Bug fix: Table 36 PKMAP corrected for dichotomies
  • 5.2.5 Enhancement: TCCFILE= TCC/TIF decimal places controlled by UDECIMALS=
  • 5.2.5 Enhancement: Analysis window: iteration bar lengthened to 80 characters from 40 characters
  • 5.2.5 Bug fix: Table 44 Pearson chi-square probability: corrected
  • 5.2.5 Bug fix: Table 23 Variance explained by person and items: improved
  • 5.2.5 Clarification: Edit menu: Edit Initial Settings: Excel Plot Interface - use winexcel.exe if possible
  • 5.2.4 Enhancement: Plots menu: Winsteps Excel plots now supported on 64-bit-only and other systems: see Excel Interface
  • 5.2.4 Bug-fix: Plots menu: R Statistics PCAEFA: correct data now analyzed
  • 5.2.4 Bug-fix: Stopped drinking so much coffee
  • 5.2.3 Enhancement: IFILE= and PFILE= measure output files. CMLE=Yes: now include CMLE values
  • 5.2.3 Bug-fix: Table 44.1 Global Fit Statistics: improved estimate of degrees of freedom in global tests
  • 5.2.3 Bug-fix: characters ^N sometimes overwrote long input data records
  • 5.2.2 Enhancement: includes 64-bit version of barcharts (bottom of graphs menu) for computers running Windows that do not support 32-bit software.
  • 5.2.2 Enhancement: in example files, name "Pete" changed to name "Lud" in honor of Larry Ludlow, long-time Rasch proponent
  • 5.2.2 Bug-fix: crash in "make default" routine of Output Tables dialog box
  • 5.2.2 Bug-fix: percentiles the same in Table 20 and SCOREFILE=
  • 5.2.2 Bug-fix: incorrect action when a file name contained the words "Weight" or "Subtotal"
  • 5.2.2 Bug-fix: corrections to x-axis scaling on Table 2, etc.
  • 5.2.1 Enhancement: includes 64-bit version of Data Setup for computers running Windows that do not support 32-bit software.
  • 5.2.0.1 Bug-fix: very rare crash in Table 9 and similar tables
  • 5.2.0 Enhancement: Output Files dialog: option to display Descriptive Statistics for output R Statistics .rdata file for each variable in the file. Statistics are: n mean sd median trimmed mad min max range skew kurtosis se Q0.25 Q0.75
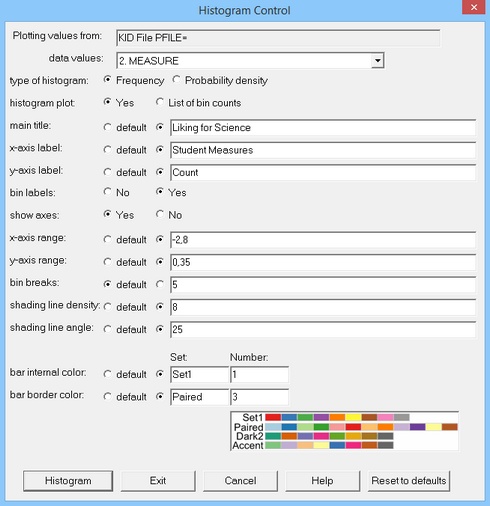
  • 5.2.0 Enhancement: Plots menu: R Statistics Histogram Plot, of any column of numbers in a Winsteps output file. Histogram control dialog launched from the Winsteps Plots menu.  
    Control dialog for histogram
     
    R Statistics Histogram of Person Measures
     
Winsteps 5.1.7 December 2021; 5.1.6 November 2021; 5.1.5 October 2021; 5.1.4 September 2021; 5.1.3, 5.1.2 August 2021; 5.1.1 August 2021; 5.1.0 July 2021
    Improvements and bug-fixes:
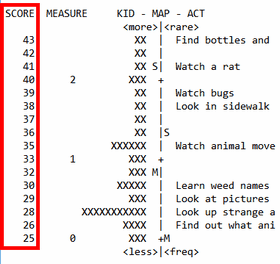
  • 5.1.7 Enhancement: T1SCORE=Yes, raw score column in Wright Maps, Tables 1, 12, 16. Use Edit Initial Settings to make T1SCORE=Yes the default.
  • 5.1.7 Enhancement: CMLE=Yes, CMLE estimation with item weights IWEIGHT= applied to CMLE/AMLE person measures.
  • 5.1.7 Bug fix: unintended changes to Output File default settings
  • 5.1.7 Bug fix: item and person measure tables: Tables 14.1, 18.1, etc.: Means and S.D.s of ZSTDs reported with 1 decimal place instead of 2.
     
  • 5.1.6 Enhancement: CMLE=Yes, IAFILE=, SAFILE=, PAFILE=, anchoring implemented for CMLE.
  • 5.1.6 Enhancement: CMLE=Yes, Tables 14.1, 18.1, etc. column means and S.D.s for CMLE and WMLE statistics.
  • 5.1.5.2 Bug fix: Push buttons in some dialogs malfunction
  • 5.1.5.1 Bug fix: Radio buttons in some dialogs malfunction
  • 5.1.5 Bug fix: EDFILE=, PLFILE= upper limit on person entry numbers is 9,999,999.
  • 5.1.5 Enhancement: EDFILE= displays first record processed
  • 5.1.5 Enhancement: IPMATRIX= allowed in control file with default settings. Use Output Files menu, IPMATRIX= to Make default settings.
  • 5.1.5 Bug fix: prevent "freeze" on Output Files menu, IFILE=, File Selection box, OK or Make Default
  • 5.1.5 Bug fix: prevent "freeze" on Output Plots menu, Scatterplot dialog box, Browse
  • 5.1.5 Bug fix: Table 36, PKMAP, position polytomous responses to match Table 2.2.
  • 5.1.5 Bug fix: Table 36, PKMAP, action "1A=00001" correctly
  • 5.1.5 Bug fix: Output Files menu, TRPOFILE=, launch temporary file
  • 5.1.5 Bug fix: plots menu, 2-D scatterplot using R, "pam failure in cluster"
     
  • 5.1.4 Enhancement: CMLE=Yes: Table 3.2 - shows CMLE and JMLE Andrich thresholds
  • 5.1.4 Bug fix: CMLE=Yes: yet more obscure CMLE bugs
  • 5.1.3 Bug fix: CMLE=Yes: more obscure CMLE bugs
  • 5.1.2 Bug fix: CMLE=Yes: crashes due to persons with extreme scores and deleted persons
  • 5.1.1 Bug fix: CMLE=Yes: several bugs in estimation of persons measures and ISGROUPS=0 polytomous item estimation
  • 5.1.1 Enhancement: CMLE=Yes: improved detection and exit on estimation overflow
  • 5.1.1 Enhancement: CMLE=Yes: allows unobserved (zero count) categories
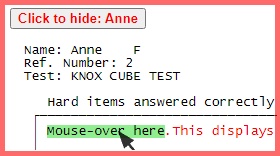
  • 5.1.1 Enhancement: Tabie 36 PKMAP: on webpage output, ASCII=Webpage, mouse-over displays the item label with 1MH=#LABEL# - see www.winsteps.com/a/pkmap.htm
  • 5.1.1 Enhancement: Tabie 36 PKMAP: on webpage output, ASCII=Webpage, click on buttons to display and hide person maps with 1CLICK=#LABEL#
  • 5.1.0 Enhancement: CMLE=Yes performs CMLE Conditional Maximum Likelihood Estimation
  • 5.1.0 Enhancement: Tables 6, 10, 13, 17, etc. show CMLE estimates and CMLE item and person fit statistics when CMLE=Yes
  • 5.1.0 Enhancement: IFILE=, PFILE= include CMLE item and AMLE person estimates and fit statistics when CMLE=Yes
  • 5.1.0 Enhancement: SFILE= includes CMLE Andrich threshold estimates when CMLE=Yes
  • 5.1.0 Enhancement: User Guide: documentation of CMLE=Yes: www.winsteps.com/winman/index.htm?cmle.htm
  • 5.1.0 Bug fix: Tables 6, 10, etc., IFILE=, PFILE=: WMLE Warm Mean Likelihood Estimate corrected: WMLE=Yes
raw scores on Wright Map
T1SCORE=Yes
Table 1 raw scores on Wright Maps


CMLE measures
Table 14 CMLE measures and fit


Table 36 PKMAP
Table 36 person-item map: details
Winsteps 5.0.2, 5.0.1 July 2021; 5.0.0 June 2021
    Improvements and bug-fixes:
  • 5.0.2 Bug fix: Anchoring in person and item labels: PAFILE=$S1W3, etc.
  • 5.0.1 Bug fix: Tables 23, 24, Diagnosis menu D. - occasional crash on launch
  • 5.0.1 Bug fix: Input file: last input records of very big input files sometimes not processed
  • 5.0.1 Bug fix: Output files: correct omission of heading lines : HLINES=No, ROW1H=No
  • 5.0.0 Enhancement: Indexing by raw score to speed up processing: number of index records shown on screen
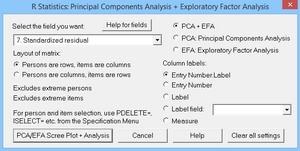
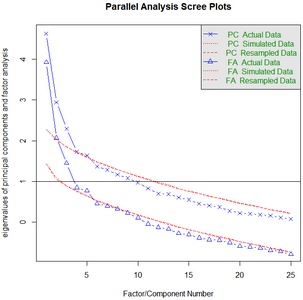
  • 5.0.0 Enhancement: R Statistics PCA/EFA analysis and Scree Plot
  • 5.0.0 Enhancement: R Statistics - more options for variable (column) titles
  • 5.0.0 Enhancement: R Statistics dataset name changed from "IPMATRIX" to "data"
  • 5.0.0 Enhancement: Tables 23 and 24: easier changing of PRCOMP= to choose basis for dimensionality analysis and wieghting correction
  • 5.0.0 Enhancement: Edit menu: Edit Initial Settings: easier to change Analysis Window font
  • 5.0.0 Enhancement: Winsteps analysis module converted from 32-bit to 64-bit software. Other modules remain 32-bit.
  • 5.0.0 Enhancement: Winsteps installer: 64-bit for 64-bit modules with sub-installer: 32-bit for 32-bit modules.
  • 5.0.0 Enhancement: ISRANGE= allows format: low-item-number-high-item-number low-category-number high-category-number


Winsteps 5.0.0: One-click PCA/EFA Scree Plots through R Statistics modules
button for PCA/EFA scatterplots button for PCA/EFA scatterplots button for PCA/EFA scatterplots
All you do is install R Statistics. One click! Winsteps does the rest!
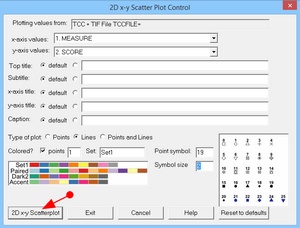
Winsteps 4.8.0: One-click 2-D x-y Scatterplots through R Statistics modules
button for 2D x-y scatterplots button for 2D x-y scatterplots button for 2D x-y scatterplots
Winsteps 4.7.0: One-click 3-D x-y-z Scatterplots through R Statistics modules
button for 3D scatterplots button for 3D scatterplots button for 3D scatterplots
Winsteps 4.6.2: One-click publication-quality graphical output through R Statistics modules
button for publication-quality graphs button for publication-quality graphs button for publication-quality graphs
Winsteps 4.6.1: One-click colorful Wright Map output through R Statistics modules
button for WrightMap graphs button for WrightMap graphs button for WrightMap graphs


Winsteps 4.8.2 May 2021; 4.8.1 April 2021; 4.8.0 February 2021
    Improvements and bug-fixes:
  • 4.8.2 Bug fix: Plots menu: Scatterplot: plot sheets labelled "Identity" (showing an identity line) and "Empirical" (showing a regression line)
  • 4.8.2 Bug fix: Output Files formats: Excel file format corrected to match filename suffix: .xls, .xlsx, .xlsm
  • 4.8.2 Bug fix: Output Files formats: Change default to yes for "Display file?"
  • 4.8.2 Bug fix: Table 27.1, 28.1: Dimensionality: Correction to occasionally incorrect "Welch" column title
  • 4.8.2 Bug fix: Table 44: Global Fit: correction for occasional division-by-zero failure
  • 4.8.2 Bug fix: Tables with plots: tweaks to scaling
  • 4.8.1 Bug fix: Table 1.9, 12.9 Average Measures plot - occasional formatting problem
  • 4.8.1 Bug fix: Table 20, TFILE= Correction to measures for extreme scores with big item weights IWEIGHT=
  • 4.8.1 Bug fix: Table 23.1 Dimensionality plot - occasional formatting problem
  • 4.8.1 Bug fix: Table 27, 28 Prevent numerical overflow in F-test computation
  • 4.8.1 Bug fix: Table 30, 31, 33 DIF, DPF, DTF TABLES - occasional small correction to degrees of freedom computation
  • 4.8.1 Bug fix: Table 36 PKMAP plot - occasional formatting problem
  • 4.8.1 Adjustment: FSHOW= usage adjusted so that it functions to display output in batch mode: BATCH= with TFILE=
  • 4.8.1 Bug fix: Analysis window Correction to "Time for estimation" computation
  • 4.8.1 Bug fix: Edit menu Correction to IWEIGHT=, PWEIGHT= link
  • 4.8.1 Bug fix: Person labels Blank person labels remain blank so that PSELECT= works correctly
  • 4.8.0 Plots Menu: 2D x-y scatterplot using R Statistics "ggplot2" package.
  • 4.8.0 Graph Window R Statistics launched with default .rdata app: RGui or RStudio
  • 4.8.0 Table 44 Equal-item-discriminations test of Parallel ICCs/IRFs
  • 4.8.0 Table 44 van den Wollenberg Q1 test of Parallel ICCs/IRFs
  • 4.8.0 EFILE= expected scores on items shown with 3 decimal places
  • 4.8.0 SIFILE= simulated data files default to "avoid extreme scores"
  • 4.8.0 Bug fix: Tables 1, 12, 16 corrected placement of persons and items on some Wright maps.
  • 4.8.0 Bug fix: SINUMBER= correct number of simulated files when SINUMBER= is in the Command Line
Winsteps 4.7.1 December 2020; 4.7.0 October 2020
    Improvements and bug-fixes:
  • 4.7.1 NOMEASURE= sets the measure or code to output in the IFILE= and PFILE= files for deleted, deselected and inestimable measures
  • 4.7.1 SCOREFILE= output file: now also outputs the expected score on each item for each raw score. This is useful when doing Angoff standard-setting.
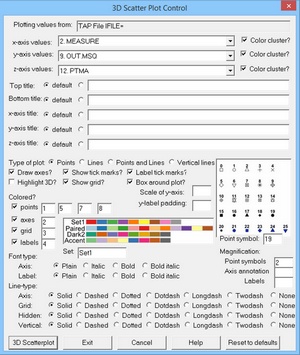
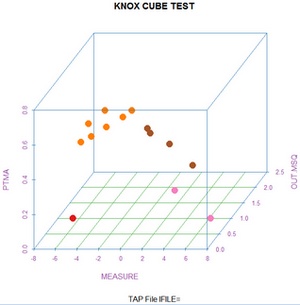
  • 4.7.0 Plots Menu: 3D x-y-z scatterplot using R Statistics "scatterplot3d" package.
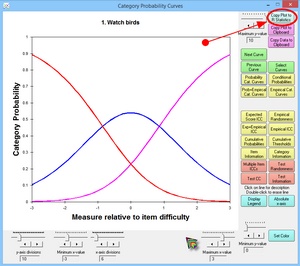
  • 4.7.0 Graphs window: Copy plot to R Statistics (ggplot2) corrections
  • 4.7.0 Bug fix: Graphs window: empirical interval size-box values
  • 4.7.0 Bug fix: LOGFILE= includes Table 0.3 expanded control file
  • 4.7.0 Bug fix: Control files: #1# token replacement corrected
  • 4.7.0 Bug fix: Table 20: Score table: occasional crashes
  • 4.7.0 Bug fix: Plots menu: Compare Statistics Scatterplot: occasionally hangs
Winsteps 4.6.2 September 2020; 4.6.1, 4.6.0 August 2020
    Improvements and bug-fixes:
  • 4.6.2 Graph Window: publication-quality graphs with R Statistics ggplot: one-click
  • 4.6.2 Graph Window: sliders: set values with numeric boxes, sliders or up-down arrows
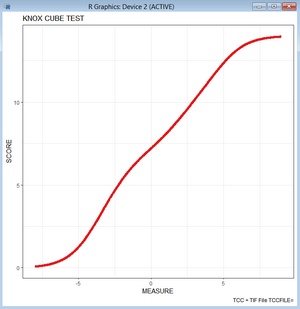
  • 4.6.2 Graph Window: Test Characteristic Curve TCC: measure range and tick interval can be set with TCCHIGH= TCCLOW= TCCINCR=
  • 4.6.2 Plots menu: R Statistics WrightMap: more options for sizing and placement of labels, symbols and lines
  • 4.6.2 TCCFILE=: measure range and tick interval can be set with TCCHIGH= TCCLOW= TCCINCR=
  • 4.6.2 Bug-fix: Graph Window: no longer at the very top of screen
  • 4.6.2 Bug-fix: Plots menu: R Statistics WrightMap: histograms for distributions with sample size 1 shown
  • 4.6.2 Bug-fix: Table 23: corrected cluster counts in the correlation tables when there are missing data
  • 4.6.2 Bug-fix: Winsteps installation routine. Current version of Winsteps always installed.
  • 4.6.1 Bug fix: Tables 27, 28: blank columns corrected
  • 4.6.1 Bug fix: Plots menu: R Statistics "WrightMap" output: y-axis from-to corrected
  • 4.6.0 Plots menu: R Statistics "WrightMap" output
  • 4.6.0 Help menu: Tables 1, 12, 16: Sizing Calculator for Wright Maps
  • 4.6.0 Table 30.5, 30.6, 31.5, 31.6: Bias and S.E. added
  • 4.6.0 Bug fix: Excel/RSSST menu: R Statistics R.exe sometimes not found
  • 4.6.0 Bug fix: Table 30.7, 31.7 formatting error
  • 4.6.0 Documentation: "Thurstone" changed to "Thurstonian"
Winsteps 4.5.5 July 2020; 4.5.4 June 2020; 4.5.3 May 2020; 4.5.2 April 2020; 4.5.1, February 2020; 4.5.0, January 2020
    Improvements and bug-fixes:
  • 4.5.5 Enhancement: Tables 27, 28 subtotals: include Mean Score and Mean Count for each group
  • 4.5.5 Enhancement: Output files IPMATRIX=: added option "Response value after recounting from zero" for data to be analyzed with software that requires observations to start from 0
  • 4.5.5 Bug fix: Table 0: prevent irrelevant display of Table 0 iteration report
  • 4.5.5 Bug fix: Tables 1, 12, 16 Wright maps: several display bugs fixed, including for MTOP=, MBOTTOM=
  • 4.5.5 Bug fix: Table 3.1 Standardized (50) Reliability: computation corrected
  • 4.5.5 Bug fix: Table 20.3 Score table for items: now works with USCALE=-1 for reversed measures
  • 4.5.5 Bug fix: Tables 30, 31, 33 Excel plots: blank cells set to zero for better display of graphs
  • 4.5.5 Bug fix: Graph window - bottom right option: Copy-screen-to-clipboard works correctly.
  • 4.5.5 Bug fix: Output Files menu, Create Facets files: works correctly
  • 4.5.4 Enhancement: Table 1, 12, 16 - MTOP=, MBOTTOM=, MUNITS= to customize Wright maps
  • 4.5.4 Enhancement: Table 23 - include cluster counts in report of cluster correlations
  • 4.5.4 Enhancement: Table 3.1 - added STANDARDIZED (50 ITEM) RELIABILITY
  • 4.5.4 Enhancement: EDFILE= allows string of observations for range of items or persons
  • 4.5.4 Enhancement: Plots menu: "Construct Alley" plot showing error bars
  • 4.5.4 Bug fix: Table 1.9 Average Measures - did not adjust for USCALE=, UMEAN=
  • 4.5.4 Bug fix: Table 20 Score Table - Predicting ... did not adjust for extreme items
  • 4.5.4 Bug fix: R statistics output: missing data set to NA
  • 4.5.4 Bug fix: Alt-e opens the Edit menu
  • 4.5.4 Bug fix: Output file only opened automatically when meaningful
  • 4.5.3 Enhancement: EXCELDECIMAL=Comma creates decimal-comma Excel spreadsheets.
  • 4.5.3 Enhancement: Tables 1, 12, 16 Wright maps: removed obsolete page-overflow headings.
  • 4.5.3 Bug fix: Person and Item measures, Table 20 score tables, TCCs have corrected measure estimates for extreme scores with weighted items or persons
  • 4.5.3 Bug fix: empty files are not displayed
  • 4.5.2 Enhancement: Graphs window: graph in bottom right of window, pullable to resize. See Winsteps Help
  • 4.5.2 Enhancement: DIF Plot: extra graph: average score by person in group on item. See Winsteps Help
  • 4.5.2 Enhancement: DPF Plot: extra graph: average score by person on item in group
  • 4.5.2 Enhancement: Documentation: Table 1 Wright maps can be rotated 90 degrees in Microsoft Word easily. Winsteps Help
  • 4.5.2 Enhancement: ROW1HEADING=Yes/No: include the first line file description in the output file (IFILE= PFILE= etc.). HLINES=No removes all heading lines.
  • 4.5.2 Bug fix: output to R Statistics .rdata file with blank space in column heading
  • 4.5.1 Bug fix: corrected "SAMPLE EXPECT" average measure for each category in Table 3.2
  • 4.5.1 Enhancement: Tables 30.2, 30.3, 31.2, 31.3, added SCORE column for raw score by each DIF group on the item/person.
  • 4.5.1 Enhancement: Table 36 PKMAP for each person: more color options with ICOLORFILE=
  • 4.5.0 QCMLE=Yes. Quasi-CMLE estimates for dichotomous data displayed in measure tables, such as Tables 13, 18.
  • 4.5.0 WMLE=Yes. Warm's Mean Likelihood estimates displayed in measure tables, such as Tables 13, 18.
  • 4.5.0 IFILE=, PFILE= fields for Quasi-CMLE & WMLE estimates show differences with JMLE estimates (usually inconsequential)
  • 4.5.0 IFILE=, PFILE= Measure shown as 9999 for deleted persons or items
  • 4.5.0 Table 20.3 Score-to-measure table for all item scores (p-values) on the complete person sample shown in Output Tables menu
  • 4.5.0 Bug fix: PSELECT= failed under some conditions
Winsteps 4.4.8 December 2019; 4.4.7 November 2019; 4.4.6 October 2019; 4.4.5 July 2019; 4.4.4, June 2019; 4.4.3, 4.4.2, May 2019; 4.4.1, April 2019; 4.4.0, March 1, 2019
    Improvements and bug-fixes:
  • 4.4.8: Bug fix: Table 30.7, 31.7 - corrected S.E. of ALL measure
  • 4.4.8: Bug fix: Table 44 Global Statistics: corrected calculation of AIC and BIC
  • 4.4.8: Excel/RSSST dialog box: only CODES= (no CODERANGE=) in Winsteps file
  • 4.4.8: Excel/RSSST dialog box: bug fix: cancels correctly from file-selection box
  • 4.4.7: Bug fix: R statistics (.rdata) operational for "Excel/RSSST" menu input and "Output Files" menu output.
  • 4.4.7: T1WEIGHT = Yes/No items/persons shown by weight, or once, in Tables 1, 12, 16
  • 4.4.7: SCREEN=filename output the Analysis window to a file: must be on the command line or in a short-cut
  • 4.4.6: UTF8ENCoded = Yes/No/? allows user to specify whether control and data files are in UTF-8 code or not
  • 4.4.6: UTF8SUBstitute character = "." allows user to specify character to display when UTF-8 cannot be displayed
  • 4.4.6: Bug fix: occasional formatting problem in Tables 30.1, 31.1 in 4.4.5
  • 4.4.5: Tables: more UTF-8 capabilities: columns reordered in some Tables
  • 4.4.5: Table 3.2: display SFUNCTION= coefficients
  • 4.4.4: UTF-8: improved, but incomplete, compatibility for input and output files. Analysis window shows Windows-1252 character set.
  • 4.4.4: TFILE= deletions and selections in post-analysis table list are temporary, not permanent
  • 4.4.4: Tables 27, 28 person and subtotals: RMSE, TRUE S.D. and Average MNSQ added to summary line
  • 4.4.3: Graphs window: corrected empirical ICC (only wrong in 4.4.2)
  • 4.4.3: Excel/RSSST dialog box: allow for slightly misformatted CSV files
  • 4.4.3: Excel/RSSST dialog box: CODERANGE= only for rating scale categories above 20.
  • 4.4.2: CODERANGE=low number - high number for the numeric range of the data codes. Example for percentages: XWIDE=3 CODERANGE=0-100 instead of CODES=" 0 1 2 ...."
  • 4.4.2: limit of 255 data codes in CODES= removed.
  • 4.4.2: rating scale / partial credit category range increased from 0-254 to 0-32767
  • 4.4.2: CUTLO= and CUTHI= are specified in logits relative to item difficulty regardless of USCALE= setting
  • 4.4.1: Output Files menu: output files in Facets format
  • 4.4.1: Graphs window: remedy bug in smoothing empirical curves
  • Tables 1.9, 12.9: Map of categories for each item, positioned by the average measure of the persons responding in each category.
  • Graphs window: Item information functions can be displayed for multiple items
  • Bug-fix: Graphs menu: menu entry calls matching graph in Graph window, when available
Winsteps 4.4.7 November 2019; 4.4.6 October 2019; 4.4.5 July 2019; 4.4.4, June 2019; 4.4.3, 4.4.2, May 2019; 4.4.1, April 2019; 4.4.0, March 1, 2019
    Improvements and bug-fixes:
  • 4.4.7: Bug fix: R statistics (.rdata) operational for "Excel/RSSST" menu input and "Output Files" menu output.
  • 4.4.7: T1WEIGHT = Yes/No items/persons shown by weight, or once, in Tables 1, 12, 16
  • 4.4.7: SCREEN=filename output the Analysis window to a file: must be on the command line or in a short-cut
  • 4.4.6: UTF8ENCoded = Yes/No/? allows user to specify whether control and data files are in UTF-8 code or not
  • 4.4.6: UTF8SUBstitute character = "." allows user to specify character to display when UTF-8 cannot be displayed
  • 4.4.6: Bug fix: occasional formatting problem in Tables 30.1, 31.1 in 4.4.5
  • 4.4.5: Tables: more UTF-8 capabilities: columns reordered in some Tables
  • 4.4.5: Table 3.2: display SFUNCTION= coefficients
  • 4.4.4: UTF-8: improved, but incomplete, compatibility for input and output files. Analysis window shows Windows-1252 character set.
  • 4.4.4: TFILE= deletions and selections in post-analysis table list are temporary, not permanent
  • 4.4.4: Tables 27, 28 person and subtotals: RMSE, TRUE S.D. and Average MNSQ added to summary line
  • 4.4.3: Graphs window: corrected empirical ICC (only wrong in 4.4.2)
  • 4.4.3: Excel/RSSST dialog box: allow for slightly misformatted CSV files
  • 4.4.3: Excel/RSSST dialog box: CODERANGE= only for rating scale categories above 20.
  • 4.4.2: CODERANGE=low number - high number for the numeric range of the data codes. Example for percentages: XWIDE=3 CODERANGE=0-100 instead of CODES=" 0 1 2 ...."
  • 4.4.2: limit of 255 data codes in CODES= removed.
  • 4.4.2: rating scale / partial credit category range increased from 0-254 to 0-32767
  • 4.4.2: CUTLO= and CUTHI= are specified in logits relative to item difficulty regardless of USCALE= setting
  • 4.4.1: Output Files menu: output files in Facets format
  • 4.4.1: Graphs window: remedy bug in smoothing empirical curves
  • Tables 1.9, 12.9: Map of categories for each item, positioned by the average measure of the persons responding in each category.
  • Graphs window: Item information functions can be displayed for multiple items
  • Bug-fix: Graphs menu: menu entry calls matching graph in Graph window, when available
Winsteps 4.3.3/4, January 2019; 4.3.2, November 24, 2018; 4.3.1, November 18, 2018; 4.3.0, November 1, 2018
    Improvements and bug-fixes:
  • 4.3.4: bug-fix in 4.3.3: Table 23, ICORFILE=, inter-item correlations, PCA of residuals: increase capacity to 65,000 items and 9,999,999 persons.
  • 4.3.3: Bug-fix: scientific notation: 4E6, 4e6, 4D6, 4d6, are now all allowed
  • 4.3.2: Table 30.1: Mantel-Haenszel/Mantel: MHZERO= to adjust zero cells in computation. MHZERO=0.5 makes cross-tabs with zero cells estimable.
  • 4.3.1: Analysis window: "Memory not available" - Winsteps can now access 1GB more memory. Example: increase in Table 23 dimensionality analysis from maximum of 280 items by 1 million persons to 400 items by 1 million persons
  • 4.3.1: Tables 23 and 24: faster processing
  • Table 1.0: MAXPAG= controls length of table, LINLEN= controls width of table
  • Table 3.1, 27.3, 28.3 - Standard Error of Mean (SEM) for all summarized statistics
  • Table 14.3: PTBIS=X column PTMX in Distractor analysis: correction to point-measure correlation excluding current items
  • Table 20, SCOREFILE= score-to-measure table : TOTALSCORE=Y shows range of observed raw scores, including extreme items
  • Table 23.2: show item cluster number in table
  • Table 23.6: show correlations below reliabilities
  • Table 30.1, 31.1: Scatterplot of pairwise DIF/DPF sizes
  • Table 33.7, 33.8: profile of Differential Group Functioning by person and item groups
  • Table 44: show Akaike Information Criterion and Bayesian Information Criterion
  • Control file: better detection of wrong control file format BOM, RTF.
  • Graphs menu: Person-Item Histograms of Measures, Half-Point Thresholds, Rasch-Thurstone Thresholds, Rasch-Andrich Thresholds, Category Probability Peaks, Measures for Scores.
  • IFILE=, PFILE= : chi-square: CHISQUARE=Yes displays chi-squares instead of mean-square statistics
  • IFILE=, PFILE= : d.f.: fields INDF, OUTDF display degrees of freedom for Infit/Outfit mean-squares or chi-squares
  • IFILE=, PFILE=, Table 14.1, 18.1: probability: LOCAL=Prob displays two-sided probability of mean-square or chi-square instead of ZSTD.
  • Scatterplots: empirical trend line now has slope equal to correlation
Winsteps 4.2.0, August 6, 2018
    Improvements and bug-fixes:
  • Tables 10.3, 13.3, 14.3, etc. Distractor analysis: speeded up. Small changes in last decimal place of some estimates.
  • Tables 30, 31, 33: DIF, DPF, DGF: estimation: convergence is now faster and more robust: small changes in some numbers. Bugs fixed.
  • EFILE= has new options: ETYPE= Expected score, or Most probable category, or Thurstone category. IWEIGHT= applies to EFILE=.
  • IAFILE=, PAFILE= anchor values with zero weight omitted from centering.
  • TCCFILE= now includes the cumulative item probabilities summed across all items for the Scale Characteristic Curves.
Winsteps 4.1.0, June 1, 2018
    Minor improvements and bug-fixes:
  • Table 1: adjusts the length of the displayed line to match LINELENGTH=
  • Table 1.7, 12.7: incorrect placement of Andrich thresholds with USCALE= corrected.
  • Tables 30, 31, 33: CLASS is now CLASS/GROUP
  • New: Table 44: shows S.E. of d.f. of log-likelihood chi-square
  • New: Table 45: now supports anchoring, weighting, item labels on plot
  • New: Graphs window: Cumulative Threshold graph (Rasch-Thurstone thresholds)
  • Subset detection: bug-fix for unobserved values in CODES=
  • EDFILE= crash with incorrect formats
  • HEADER=NO reliability heading line also not displayed
  • ISFILE= heading "AT CAT" is now "AT.CAT" to simplify copy-and-paste to Excel, etc.
  • ISELECT= crash when no items selected
  • KEY= is the same as KEY1=
  • New: PLFILE= for input list of person labels (similar to ILFILE=)
Winsteps 4.0.1, July 28, 2017
  • Table 1.0 with large files: program crash repaired
  • Tables 1.3, 1.13, 16.3, 16.13: omitted lines displayed. Excess blank lines removed.
  • Table 44: global chi-square d.f. estimate has standard error shown
  • Table 45: blank persons not shown in legend. Other bugs fixed.
  • Excel/RSSST dialog: corrections to Tab-Separated conversion (some cases omitted).
    SAS error message for incompatible SAS files due to SAS Local Provider limitations.
Winsteps 4.0.0, June 21, 2017
  • Table 45 cumulative person measures by item - table and plot
  • Excel files: default output to .xlsx files. "Edit initial settings" for .xls
  • Tables 6 and 10: message "BETTER FITTING OMITTED" changed to "BETTER FITTING NOT SHOWN"
  • Bugs: several rare bugs squashed
Winsteps 3.93, April 30, 2017
  • ISELECT= or PSELECT= selection command: now with fieldnames: PSELECT=@GENDER=F to select only females
  • ISELECT= or PSELECT= selection command: incremental selection using +ISELECT= OR +PSELECT= corrected
  • DISFILE= distractor output file: totalling option: by item-category, DISOPTION=Category or by item-score, DISOPTION=Score.
  • AGREEFILE= agreement file: extra columns for coordinates of points in Paired-person Agreement Table, Table 35.
  • Table 12 - Wright item-person maps display correctly.
  • Table 23 - dimensionality: person measures and correlations: usually very small corrections
  • Chrome Remote Desktop on your smartphone can display and operate Winsteps running on your PC (thanks, William P. Fisher, Jr.)
  • Bugs: several rare bugs squashed
  • Bug fix 3.93.1: table display as webpage failed in 3.93.0 with Warning (24)
  • Bug fix 3.93.2: Tables 1.5-1.8, 12.5-12.8 correctly place column headings and display items in strict measure order vertically
Winsteps 3.92.1, February 5, 2016, squashes minor bugs in 3.92.0
  • "WARNING: DUPLICATE MEMORY ASSIGNMENT" - annoying inconsequential message removed.
  • Graph window - can be moved and resized
  • Table 23 - person measure correlations: usually very small correction

    Bugs in 3.92.1
  • Table 23.6 - occasional unreasonably large standard errors for the PCA-based person estimates, causing unreasonably high disattenuated correlations. Work-around: Please contact Winsteps.com if this is a problem for you.
Winsteps 3.92.0 (replaces 3.91.2), February 1, 2016
  • ANCESTIM=Yes may give improved IAFILE=/PAFILE= item/person anchoring compared with standard Winsteps estimation, when there are few person/item anchors in a large or sparse dataset.
     
    Unanchored estimation is unchanged since Winsteps 3.75
    ---------------------------------------------------------------------------------------------------
    |ENTRY   TOTAL  TOTAL           MODEL|   INFIT  |  OUTFIT  |PTMEASUR-AL|EXACT MATCH|              |
    |NUMBER  SCORE  COUNT  MEASURE  S.E. |MNSQ  ZSTD|MNSQ  ZSTD|CORR.  EXP.| OBS%  EXP%| TAP          |
    |------------------------------------+----------+----------+-----------+-----------+--------------|
    |     3     35     35   -6.59    1.85| MINIMUM MEASURE     |  .00   .00|100.0 100.0| 1-2-4        |
    |     4     32     35   -4.40     .81| .90    .0| .35   -.2|  .55   .53| 94.1  94.0| 1-3-4        |
    |     5     31     35   -3.83     .70|1.04    .2| .52    .1|  .55   .55| 88.2  91.7| 2-1-4        |

     
    With anchoring: IAFILE=* 4,10 * and ANCESTIM=No (the default), estimates are unchanged since Winsteps 3.75
    ------------------------------------------------------------------------------------------------------------
    |ENTRY   TOTAL  TOTAL           MODEL|   INFIT  |  OUTFIT  |PTMEASUR-AL|EXACT MATCH|        |              |
    |NUMBER  SCORE  COUNT  MEASURE  S.E. |MNSQ  ZSTD|MNSQ  ZSTD|CORR.  EXP.| OBS%  EXP%|DISPLACE| TAP          |
    |------------------------------------+----------+----------+-----------+-----------+--------+--------------|
    |     3     35     35    7.62    1.85| MINIMUM MEASURE     |  .00   .00|100.0 100.0|    -.02| 1-2-4        |
    |     4     32     35   10.00A    .77| .81   -.3| .30   -.2|  .55   .53| 97.1  93.2|    -.24| 1-3-4        |
    |     5     31     35   10.37     .70|1.04    .2| .52    .1|  .55   .55| 88.2  91.7|    -.02| 2-1-4        |

     
    With anchoring: IAFILE=* 4,10 * and ANCESTIM=Yes may give better estimates. Notice that the DISPLACEments are smaller.
    ------------------------------------------------------------------------------------------------------------
    |ENTRY   TOTAL  TOTAL           MODEL|   INFIT  |  OUTFIT  |PTMEASUR-AL|EXACT MATCH|        |              |
    |NUMBER  SCORE  COUNT  MEASURE  S.E. |MNSQ  ZSTD|MNSQ  ZSTD|CORR.  EXP.| OBS%  EXP%|DISPLACE| TAP          |
    |------------------------------------+----------+----------+-----------+-----------+--------+--------------|
    |     3     35     35    7.81    1.85| MINIMUM MEASURE     |  .00   .00|100.0 100.0|    -.03| 1-2-4        |
    |     4     32     35   10.00A    .82| .91    .0| .34   -.2|  .55   .53| 94.1  94.0|    -.03| 1-3-4        |
    |     5     31     35   10.58     .71|1.05    .3| .52    .1|  .55   .56| 88.2  91.8|    -.03| 2-1-4        |

     
  • Table 0: Convergence tables. Values for PROX iterations more accurately reported, but not changed.
  • Table 14.3 and similar, categories labeling with CFILE= corrected.
  • Table 26.1, etc.: mean and S.D. of displacements is reported.
  • Table 29: Empirical Code Frequencies. Dotted probability curves corrected when categories do not start at 0.
  • Tables 30, 31: Welch t-statistics. Usually small corrections to the d.f., t-statistics and probabilities.
  • Tables 30, 31, 33: estimation iterations always stop and better DIF/DPF/DGF measure estimates for classes with extreme scores
  • MPROX=0: no PROX starting values. Starting values for JMLE/UCON are 0.00 logits
  • SIFILE= data simulation. "Warning: no memory array slots available. Ref. 19" corrected.
  • Edit menu, Initial settings (user preferences), occasional failure to save is corrected.
Winsteps 3.92.0 known bugs or deficiencies
  • Windows 10: installation may hang before completion. The reason is not yet known.
    work-around: Winsteps is correctly installed. Please go to your c:\Winsteps. Right-click on Winsteps.exe to create a short-cut.
  • Importing STATA .dta files: "string length problem". Winsteps does not support STATA 14 or later .dta files
    work-around: To read a STATA 14 or later file with Winsteps, first in STATA,
    . saveold filename13, version(13)
    Then filename13.dta can be processed by Winsteps.
  • Winsteps-generated Excel spreadsheets: Excel 2010 may plot incorrectly when it interprets person and item labels that look like numbers as numbers
    work-around: Please make the person labels definitely non-numeric by including a non-numeric character in the labels, such as _ (underline)
  • Dual monitors. Winsteps graph window displays on primary monitor after being dragged to secondary monitor.
Known bugs in Winsteps 3.91.2: please revert to 3.91.0
  • PAFILE= IAFILE=: failure to converge and obvious mis-estimation. The bug-fix in 3.91.2 has caused new problems.
    work-around: please revert to any earlier version of Winsteps
  • DIF sizes and standard errors: obviously excessively large.
    work-around: please revert to any earlier version of Winsteps
  • Enhancements in 3.91.2 are shown under 3.92.0
Winsteps 3.91.0 - September 22, 2015Description
 
---------------------------------------------------------------------------------------------------
|ENTRY   TOTAL  TOTAL           MODEL|   INFIT  |  OUTFIT  |PTMEASUR-AL|EXACT MATCH|              |
|NUMBER  SCORE  COUNT  MEASURE  S.E. |MNSQ  ZSTD|MNSQ  ZSTD|CORR.  EXP.| OBS%  EXP%| TAP          |
|------------------------------------+----------+----------+-----------+-----------+--------------|
|     3     35     35   -6.59    1.85| MINIMUM MEASURE     |  .00   .00|100.0 100.0| 1-2-4        |
|     4     32     35   -4.40     .81| .90    .0| .35   -.2|  .55   .53| 94.1  94.0| 1-3-4        |
|     5     31     35   -3.83     .70|1.04    .2| .52    .1|  .55   .55| 88.2  91.7| 2-1-4        |

 
With anchoring: IAFILE=* 4,10 *  
------------------------------------------------------------------------------------------------------------
|ENTRY   TOTAL  TOTAL           MODEL|   INFIT  |  OUTFIT  |PTMEASUR-AL|EXACT MATCH|        |              |
|NUMBER  SCORE  COUNT  MEASURE  S.E. |MNSQ  ZSTD|MNSQ  ZSTD|CORR.  EXP.| OBS%  EXP%|DISPLACE| TAP          |
|------------------------------------+----------+----------+-----------+-----------+--------+--------------|
|     3     35     35    7.62    1.85| MINIMUM MEASURE     |  .00   .00|100.0 100.0|    -.02| 1-2-4        |
|     4     32     35   10.00A    .77| .81   -.3| .30   -.2|  .55   .53| 97.1  93.2|    -.24| 1-3-4        |
|     5     31     35   10.37     .70|1.04    .2| .52    .1|  .55   .55| 88.2  91.7|    -.02| 2-1-4        |

Bugs fixed and other tweaks
. Tables 30, 31, 33, Differential Item Functioning DIF, Differential Person Functioning DPF, Differential Group Functioning DGF DIF/DPF/DGF Measures and Contrasts were incorrect due to estimation process stopping too soon. Corrected.
. Tables 1, 12, 16. Wright person-item maps. IMAP= and PMAP= IMAP= and PMAP= were not fully functional. Corrected.
. Tables 12.5, 12.6, 12.7 Wright Maps for persons Tables 12.5, 12.6, 12.7 omit items that are on continuation lines in Table 12.8. Corrected in 3.90.2.
.Graphs menu, graphs window, flipped curves. When cumulative probability curves were flipped, the legends did not match the curves. Corrected.
.IDFILE=, PDFILE= item deletion file, person deletion file Errors corrected in 3.90.1 include:
Error messages for IDFILE= or PDFILE= incorrectly report errors for IDELETE= or PDELETE=
IDFILE= * 5 10 60 87 88 111 118 (all on one line) causes "Winsteps has stopped working".
. IDFILE= etc., Winsteps-generated Excel spreadsheets unwanted quotemarks around contents of worksheet cells, for example, "Measure". Corrected in 3.90.1
"Excel-related error in WINEXCEL 3.90.0 at nsavefile 2130: 1004 The file could not be accessed." Corrected error message in 3.90.2.
. Plots menu, Excel Scatterplot "Excel-related error in Winexcel 3.90.0 at scatterse 11520:1004". Corrected in 3.90.3.
. Table 23, Excel Cluster Plot Excel 2010 compatibility: person label moved to last column of data in Excel worksheet
. Silent Install instructions. Instructions for silent install of Winsteps corrected in Winsteps Help

Winsteps 3.90.0 - April 28, 2015Description
 
---------------------------------------------------------------------------------------------------
|ENTRY   TOTAL  TOTAL           MODEL|   INFIT  |  OUTFIT  |PTMEASUR-AL|EXACT MATCH|              |
|NUMBER  SCORE  COUNT  MEASURE  S.E. |MNSQ  ZSTD|MNSQ  ZSTD|CORR.  EXP.| OBS%  EXP%| TAP          |
|------------------------------------+----------+----------+-----------+-----------+--------------|
|     3     35     35   -6.59    1.85| MINIMUM MEASURE     |  .00   .00|100.0 100.0| 1-2-4        |
|     4     32     35   -4.40     .81| .90    .0| .35   -.2|  .55   .53| 94.1  94.0| 1-3-4        |
|     5     31     35   -3.83     .70|1.04    .2| .52    .1|  .55   .55| 88.2  91.7| 2-1-4        |

. Winsteps graph menu: "Winsteps graphing failed at WINVBEXE 3.90.0 7986: 9 Subscript out of range" Work-around: Winsteps 3.90 is not probably installed. Please delete Winsteps.exe and reinstall Winsteps 3.90.
New in this version
. Table 1.8, 12.8 item-person Wright map Each item is shown at all the locations on the latent variable corresponding to all raw scores on the item.
Tables 1.8, 12.8 match Table 2.2.
. Table 23.6 person measure scatterplot Excel scatterplots of person measures for 3 item clusters in Contrast 1, reported in Table 23.6
. Table 44 global statistics Global statistics (previously in Table 3.1) moved to their own table.
Log-likelihood chi-squared statistic has degrees of freedom estimated by data simulation
. Winsteps User Manual PDF This PDF of 700+ pages is now a separate free download so that the Winsteps-installation download-size is reduced by 40%.
Improvements
. Table 3.1 summary statistics
  • Population Standard Deviation, P.SD, and Sample Standard Deviation, S.SD, reported
  • The Classical Test Theory (average) Standard Error of Measurement, SEM, is shown with Cronbach Alpha = Person raw score sample standard deviation * √(1 - Cronbach Alpha Reliability)
  • Valid Responses/Missing Responses % - see Table 44.
  • . Table 20.1 score table
  • Maximum possible number of statistically-different levels of performance on the test/instrument are shown
  • UIMEAN= and USCALE= conversion values display with (UDECIMALS= + 2) decimal places
  • . DISFILE= distractor file Distractor/option file include standard deviation of person measures and the Infit Mean-Squares
    Bugs fixed and other tweaks
    . Table 0.4, 6.1, 10.1, etc. subset reports Misleading report of subsets for anchored items corrected.
    . Table 1, 12, 16, item-person Wright maps
  • MORE= LESS= RARE= FREQ= corrected for some subtables
  • Left-align labels so that labels with leading blanks are displayed
  • 1.0: Some persons with extreme scores were omitted, now displayed
  • 1.5, 12.5: Person-Item Wright map with expected score zones: slightly corrected vertical placement.
  • 12.5, 12.6, 12.7: Prevent malfunction due to internal storage overwrite
  • . Tables 6.1, 10.1, 13.1, 17.1, etc., item and person measure tables
  • "ERROR" replaced by "S.E."
  • 6.1, 17.1, etc. Person point-correlations only reported when meaningful: (i) all items dichotomies, (ii) all items in the same ISGROUP= group, (iii) all items have three categories, which can be in different ISGROUPS= groups.
  • 14.1, 18.1: Measure shown for anchored item/person/item even when dropped from the analysis
  • 14.1, 18.1: Total score and total count shown for dropped item/person
  • 14.1, 18.1: Person/item status codes changed to include reasons they were omitted from the analysis
  • . Table 7.1, 11.1, person/item response listing With T7OPTIONS=E: E = expected value = observed item score - residual, not recounted item score - residual
    . Table 10.3, 13.3, etc., item option/distractor reports For each item option/distractor the standard deviation of the person measures and the Infit Mean-Square are also shown
    . Table 23, 24 dimensionality analysis (PCA of residuals)
  • Eigenvalues (contrast sizes) displayed with 4 decimal places
  • When subtest reliability is zero, disattenuated correlation is reported as "undefined"
  • . Table 27.1, 27.3, 28.1, 28.3 item/person subtotal reports
  • Population and Sample Standard Deviations reported, P.SD and S.SD
  • Fixed-effects chi-squared is "inestimable" when some counts are too small or some variances are zero
  • . Table 30.4, 31.4 DIF/DPF reports
  • All DIF/DPF classes reported, including those with extreme subscores
  • Summary DIF chi-squared: decimal points aligned
  • skips omitted items
  • . Table 32 control specifications Winsteps version number added to variable list
    . BATCH= batch mode No screen-flashing in Winsteps batch mode
    . DELIMITER=, SEPARATOR= tab-separated data file Correct parsing of tab-separated input data files with DELIMITER=TAB and DELIMITER=";"
    . IDFILE=, PDFILE=, IDELQU=, PDELQU= deletion command deleted items/persons can be listed in lines with the same format as IDELETE=
    . IFILE=, PFILE= item/person measure files
  • Measure shown for anchored item/person/item even when dropped from the analysis
  • Total score and total count shown for dropped item/person
  • Person/item status codes changed to include reasons they were omitted from the analysis
  • IFILE=: correct output fields with ASYMPTOTE=YES
  • . IPMATRIX= dialog box Data matrix can be any of fields in XFILE=
    . ISELECT=, PSELECT=, IDELETE=, PDELETE= In Specification menu dialog box, ISELECT= resets temporary item selection, similarly PSELECT=, IDELETE=, PDELETE=
    . ISFILE= item-structure file Item labels included
    . ISGROUPS= ISUBTOTAL= ISRANGE= Remove conflicts when two or three of these commands are used in the same analysis
    . LOGFILE= accumulated control files Prevent malfunction due to reusing device name already in use.
    . SAFILE= structure (Andrich Threshold) anchor file Warning message to screen for polytomies when IAFILE= item-anchor file specified without SAFILE=
    . SIFILE= Output Files menu: simulation dialog box "Avoid extreme scores" option now functional
    . XFILE= response file Most Probable Response for a deleted item set to -1
    . Graphs menu: Graphs window
  • Graphs window does not hide the Windows task bar
  • Option curves display correctly with Absolute scaling
  • Probability curves, Empirical curves and Option curves display same color sequence
  • . Output Files menu: Output File Formats Output files are opened using the program specified by the Windows filetype for the output file suffix
    . Plots menu: Excel plotting
  • Scatterplot worksheet: corrected disattenuated correlation computation: added missing SQRT(...)
  • Scatterplot worksheet: corrected computation of t-tests in column Q
  • Prevent "Type mismatch" failure in some versions of Excel
  • Winsteps-Excel Interface version number shown in error box
  • Prevent Excel failure due to work-file deletion when Winsteps is closed before the Excel plot displays
  • . Winsteps Analysis window When launched, make this temporarily the top window with normal size

    Known Bugs in Winsteps 3.81.0

    If squashing one of these bugs is vital to your analysis, please tell us using the "Write here:" form below. There may be a hot-fix.

    1. BATCH=YES with .sav output file can fail with "SPSS Interface: Input work file incorrect"
      Work-around: remove BATCH=Y from the batch file. Insert BATCH=YES into the control files. The Winsteps analysis screens will display and then disappear, but Winsteps-batch-mode functions correctly.
    2. CFILE= can display incorrect labels in Table 3.2 and PCURVE= curves.
      Work-around: use CLFILE=
    3. DATA= must point to a correctly-formatted text file, but Winsteps does not verify this, so processes other file formats with strange results.
      Work-around: please look at the Winsteps Analysis window. Does the first line of the data look correct? It is shown on the line below "Input Data Record". If not, reformat the data file as a text file.
    4. DELIMITER=TAB, input data files with tabs: format incorrectly.
      Work-around: 1) FORMAT= with 1X for tabs. Example: FORMAT=(8A,10(1X,A)) NAME1=1 NAMLEN=8 ITEM1=9 NI=10
      2) Paste the data into Excel. Leave the first row blank or paste in the item labels. Save the Excel file. Use the Winsteps Excel/RSST menu to create a Winsteps control and data file. Paste your item labels, etc., into that control file.
    5. IFILE=. When ASYMPTOTE=YES, the IFILE= output column headings can be wrong.
      Work-around: in Field Selection, set ASYMPTOTE=NO, or set only ASYMPTOTE=YES
    6. ISELECT= and PSELECT= do not reset in the Specification menu dialog box.
      Work-around: for different ISELECT= and PSELECT=, rerun the analysis.
    7. OFILE= can malfunction.
      Work-around: copy-and-paste output into a new file.
    8. PTBISERIAL=All, PTBISERIAL=Yes: Table 14.3 and similar, DISFILE=, unscored missing data distorts the computation of distractor/option correlations.
      Work-around: use correlations from PTBISERIAL=M.
    9. PTBISERIAL=X (PTMX), point-measure correlation excluding current observation: incorrect computation.
        Work-around for one item at a time:
      1. From an analysis of all the items, output IFILE=if.txt, SFILE=sf.txt
      2. In a new analysis, IAFILE=if.txt, SAFILE=sf.txt, IWEIGHT=0 for the target item. PTBISERIAL=M.
      3. PTMA in the new analysis for the target item is its PTMX
    10. UPMEAN=, UIMEAN= can compute incorrectly with weighting.
      Work-around: notice the incorrect value in Table 3.1, then set UPMEAN= or UIMEAN= to - incorrect value.
    11. Tables 1, 12, 16: FREQ=, MORE=, LESS=, RARE= ignored for some subtables.
      Work-around: edit the output tables.
    12. Table 1.3, 1.13, 16.3, 16.13 persons with extreme scores may not be shown.
      Work-around: edit in missing persons by looking at other subtables.
    13. Table 12.5, 12.6, 12.7 Winsteps failure when there are long item names and many polytomous categories.
      Work-around: use the Specification menu box to enter IMAP=1W10 to shorten the item label before Table 12. Then IMAP= afterwards.
    14. Table 12.12, the item easiness distribution is incorrect.
        Work-around:
      1. Output Table 12:12. Copy into Microsoft Word with Courier font
      2. Specification menu box
        USCALE=-1
        OK
      3. Output Table 12.2. . Copy into Microsoft Word with Courier font
      4. Rectangular copy (alt+mouse) the item distribution from Table 12.2 into Table 12.12.
    15. Table 27.1, 28.1, Fixed-Effects Chi-Square: incorrect computation.
      Work-around: see www.rasch.org/rmt/rmt62b.htm
    16. Table 30.4 and similar: chi-square computation incorrect when a class has extreme scores.
      Work-around: compute by hand, see Help for Table 30.4
    17. Graph window: failure: Winsteps Graphing failed at WINVBEXE 3.81.0 Wingraph 22470:9 Subscript out of range.
      Work-around: Winsteps is incorrectly installed. Please reboot your computer and reinstall Winsteps.
    18. Graph window: Empirical Option curves, Absolute scaling: incorrectly displayed
      Work-around: use the Empirical category curves, or construct the curves from XFILE=
    19. Graph window: window is behind Windows task bar
      Work-around: move the Windows task bar. Right-click on it. Uncheck "Lock". Drag task bar to a different side of the screen.
    20. Plots menu: Compare Statistics scatterplot: disattenuated correlation incorrect computation.
      Work-around: in Excel Worksheet, add the SQRT, Example:
      =MIN(1,CORREL($B$3:$B$22,$D$3:$D$22)* SQRT( (VAR($B$3:$B$22)*VAR($D$3:$D$22)/(( VAR($B$3:$B$22) - SUMSQ($C$3:$C$22)/COUNT($C$3:$C$22))*(VAR($D$3:$D$22) - SUMSQ($E$3:$E$22)/COUNT($E$3:$E$22))))) )

    Winsteps 3.81.0
    February, 2014
    Description
     
    ---------------------------------------------------------------------------------------------------
    |ENTRY   TOTAL  TOTAL           MODEL|   INFIT  |  OUTFIT  |PTMEASURE-A|EXACT MATCH|              |
    |NUMBER  SCORE  COUNT  MEASURE  S.E. |MNSQ  ZSTD|MNSQ  ZSTD|CORR.  EXP.| OBS%  EXP%| TAP          |
    |------------------------------------+----------+----------+-----------+-----------+--------------|
    |     3     35     35   -6.59    1.85| MINIMUM MEASURE     |  .00   .00|100.0 100.0| 1-2-4        |
    |     4     32     35   -4.40     .81| .90    .0| .35   -.2|  .55   .53| 94.1  94.0| 1-3-4        |
    |     5     31     35   -3.83     .70|1.04    .2| .52    .1|  .55   .55| 88.2  91.7| 2-1-4        |

    Bugs fixed from previous versions
    . Table 3.1 Log-likelihood chi-square has range of degrees of freedom and probabilities due to ambiguity computing exact d.f.
    was: with 429 d.f. p=1.0000
    now: with d.f. in the range 429 to 476, prob.=.9845 to prob.=1.0000
    . Table 3.2, etc. Counts of Missing observations now include those in extreme scores
    . Table 6.1, 10.1, etc. Correct assignment of column headings, "RMSR" and "WEIGH" to the column contents.
    . Table 6.1, 10.1, etc., Analysis window Correction of subset detection and reporting when some items or persons are anchored.
    . Table 12 Corrected memory allocation error that causes occasional program crash.
    . Table 23.1, etc. Right-align correlations in the correlation table.
    . Table 30, 31, 33: DIF/DPF/DGF plots Prevent truncation of numbers that caused misleading plots when UDECIMALS=0
    . Table 30.4, 31.4 Corrected computation for the Between-Class DIF Unweighted Mean-Square
    ----------------------------------------------------------------------------------
    | KID        SUMMARY DIF               BETWEEN-CLASS       TAP                   |
    | CLASSES    CHI-SQUARE   D.F.  PROB.  UNWTD MNSQ  t=ZSTD  Number Name           |
    |--------------------------------------------------------------------------------|
    |       2         .6673      1  .4140       .7038   .2370       6 3-4-1          |
    |       2         .0021      1  .9636       .0022 -1.3759       7 1-4-3-2        |
    |       2        1.9350      1  .1642      2.1008  1.0670      13 1-4-3-2-4      |
    |       0         .0000      0 1.0000       .0000   .0000      18 4-1-3-4-2-1-4  |
    ----------------------------------------------------------------------------------
    . IFILE=, PFILE=, item and person files Corrected COUNTs for DROPPED persons and items
    . Analysis window Replace tabs with blanks before displaying input record, so that displayed alignment matches internal alignment.
    C001 CBCABBAABACAABCABBCBAABCCCCBBA
    ^P   ^I                           ^N
    . "Graphs" window: Empirical plotted points Entire range of empirical points can be displayed.
    . "Graphs" window: Test Empirical Randomness Computation corrected.
    . "Diagnosis" menu "C. Category Function 3.2+" displays all Tables 3.2, 3.3, etc., rating scales
    . "Plots" menu: Excel Scatterplot Correction of plotting failure due to Excel interpreting some item or person labels as invalid numbers
    . "Plots" menu: all plots Correction of failure due to incompatibility with some earlier versions of Excel
    . "Output Files" menu Correct files check-marked when they have been output.
    Enhancements
    . Table 14.1, 18.1 Show counts and scores for DROPPED and INESTIMABLE persons and items
    -------------------------------------------------------------
    |ENTRY   TOTAL  TOTAL           MODEL|   INFIT  |  OUTFIT  |
    |NUMBER  SCORE  COUNT  MEASURE  S.E. |MNSQ  ZSTD|MNSQ  ZSTD|
    |------------------------------------+----------+----------+-
    |     8     27     35                | DROPPED             |
    |    10      0     35                | INESTIMABLE: HIGH   |
    |    11     35     35                | INESTIMABLE: LOW    |
    . Table 23.1, etc. Improved headings for variance Tables to match other Tables.
    was: -- Empirical -- Modeled
    now: -- Observed -- Expected

    . Table 30.1, etc. Report number of active slices used in Mantel-Haenszel DIF computation.
    --------..-------------------------------------------
    | KID      Mantel-Haenszel Size Active TAP          |
    | CLASS    Chi-squ Prob. CUMLOR Slices Number  Name |
    |-------..------------------------------------------|
    | F          .0000 1.000             7      4 1-3-4 |
    | F          .1316 .7167   -.06      7     10 2-4-3-|
    --------..-------------------------------------------
    Width of Mantel-Haenszel slice: MHSLICE = .010 logits
    . Table 42.1 Persons in displacement order matching item Table 25.1
    . Table 43.1 Persons in correlation order matching item Table 26.1
    . CMATRIX=Yes and Table 3.2, etc. When CMATRIX=Yes, output a Category Matrix of the dichotomous or rating-scale categories comparing the Observed Category Frequencies against the Predicted Category Frequencies.
    -------------------------------------------------------
    | Category Matrix : Confusion Matrix : Matching Matrix|
    |             Predicted Scored-Category Frequency     |
    |Obs Cat Freq|           0           1 |        Total |
    |------------+-------------------------+--------------|
    |          0 |      254.70       34.30 |       289.00 |
    |          1 |       34.17      306.83 |       341.00 |
    |------------+-------------------------+--------------|
    |      Total |      288.88      341.12 |       630.00 |
    -------------------------------------------------------
    . IPEXTREME= and Table 1, 12, 16 Placement of persons or items with extreme scores on the Person-Item maps.
    IPEXTREME=Yes. Persons and items with extreme scores placed at the extreme ends of the map.
    IPEXTREME=No. Persons and items with extreme scores placed at their estimated measures on the map.
    . ISFILE= Item-Structure file Include columns for Rasch-Andrich thresholds (THRESH) and amend column headings
    . MTICK= and Table 1, 2, etc. Specifies the measurement distance between tick marks
    -6       -4        -2         0         2         4         6
    |---------+---------+---------+---------+---------+---------|  NUM   TAP
    0                                                0    :     1   15  1-3-2-4-1-3
    . "Graphs" window: "Legend" button Display/Hide Legend active for all graphs.
    . #1#=, etc., tokens #1#= to #9#= are user-defined replaceable tokens of up to 32 characters each. Example:
    Extra Specifications? #3#=analysis2
    Control file:
    PFILE = #3#pf.txt ; this is processed as PFILE = analysis2pf.txt
    . Winsteps short-cuts "Winsteps" label (name) on Windows short-cuts changed to "Winsteps Rasch"
    Winsteps 3.80.1
    September, 2013
    Description
    Bug fixes
    . IFILE=, PFILE=, WMLE Corrected value of Warm's Mean Likelihood Estimate reported for extreme scores = MLE value
    . Menu bar, Diagnosis Menu Display of correct Tables and Subtables
    . Example file, Example0.txt Corrected by removing the errant lines: TFILE=* 23
    . Table 5.2, Table 9.2 ASCII=web: web-page formatting: &#...; corrected to ·
    . Analysis window, Report output file? Display a webpage or Word .doc with the Browser, e.g., Report output file? Myoutput.htm
    . Output Tables in web format: ASCII=web Correct length of underline of heading
    . Plots menu: Excel plots Avoid known bug in some versions of Excel when charts are initiated
    . Edit Initial Settings: Initial settings text box "Variable = name" removed
    . Installation: Silent Install Corrected instructions for a silent install of Winsteps
    Winsteps 3.80.0
    August, 2013
    Description
    Major Enhancements
    . Tables 23.6, 23.16, 23.26, 23.36, 23.46: person measures for item contrasts Table 23.6, etc., Person measures on item clusters within PCA Contrasts
    . Table 34, Scatterplot, IFILE=, PFILE= output files: "Warm" WLE estimates Thomas Warm's (1989) Weighted Mean Likelihood Estimates can be displayed in PFILE= and IFILE=. WLE estimates can also be plotted in the Compare-statistics scatterplot and Table 34. See also The Efficacy of Warm's Weighted Mean Likelihood Estimate (WLE) Correction to Maximum Likelihood Estimate (MLE) Bias.
    . Control instruction: TFILE= output Table selectionTFILE= enables a list of Tables, Subtables and Control instructions to be built into the Control file and reported. Every subtable can be reported individually.
    Minor Enhancements
    . Table 0.4: report of disjoint subsetsTable 0.4 shows Subset Details for the improved disjoint-subset-detection (connectivity) algorithm, which also reports Guttman splits in the data.
    . Tables 1.5, 1.6, 1.7: thresholds in "Wright" Maps of the latent variable. Table 1.5 Item map with expected score zones
    Table 1.6 Item map with 50% cumulative probabilities (Rasch-Thurstone thresholds)
    Table 1.7 Item map with Andrich thresholds (modal categories if ordered)
    . Tables 1.10-1.13, 12.12, 16.13: item easinessTable 1.10, etc., Item easiness = 2 * Person mean ability - Item difficulty
    . Tables 1.11, 1.13, 16.13. Item easiness in "Wright" Maps of the latent variable. Table 1.11, Map of distributions - persons by ability and items by easiness
    Table 1.13 Map of person labels with item distribution by easiness, same as Table 16.13
    . Tables 2.5, 2.6, 2.7, 2.15, 2.16, 2.17: x-axis range Table 2.5, etc., have the same x-axis range as other Table 2 subtables
    . Tables 3.1, 28.3, 29.3, etc.: percentsTable 3.1, etc., shows % next to counts of extreme maximum and extreme minimum persons and items.
    . Tables 6, 10, 23, 24, etc.: sort orderWhen two persons or items have the same sort values, such as fit statistics or loadings, they are ordered by Entry number.
    . Tables 14, 18, etc.: IFILE=, PFILE=, PTBISERIAL=: point-measure correlation PTBISERIAL= ALL, YES, NO, X controls the computation of the point-biserial computations shown in Table 14.1, Table 18.1, IFILE=, PFILE=and similar output.
    PTBISERIAL= ALL - the correlation of the observations and the raw scores for all responses to an item or by a person
    PTBISERIAL= Yes - the correlation of the observations and the raw scores (less the current response) for all responses to an item or by a person
    PTBISERIAL= No - the correlation of the observations and the Rasch measures for all responses to an item or by a person
    PTBISERIAL= X - the correlation of the observations and the Rasch measures (estimated omitting the current response) for all responses to an item or by a person.
    The expected values of the correlations under Rasch conditions are also reported.
    . Table 21: Subtables renumbered by item group First item group: Table 21.1, and for polytomous items, 21.2, 21.3
    Second item group: Table 21.11, and for polytomous items, 21.12, 21.13
    ...
    . Tables 23 and 24: Subtables renumbered by Contrast Contrast 1: Table 23.1, Table 23.2, Table 23.3, Table 23.4, Table 23.5, Table 23.6
    Contrast 2: Table 23.11, 23.12, 23.13, 23.14, 23.15, 23.16
    Contrast 3: Table 23.21, 23.22, 23.23, 23.24, 23.25, 23.26
    Contrast 4: Table 23.31, 23.32, 23.33, 23.34, 23.35, 23.36
    Contrast 5: Table 23.41, 23.42, 23.43, 23.44, 23.45, 23.46
    Similarly for Table 24.1, ...
    . Tables 23.1 and 24.1, etc.: show person distributionTable 23.1, etc., person distribution shown below item Contrast plot, and Table 24.1, etc., item distribution shown below person Contrast plot.
    . Table 35: subtable numberTable 35 Paired-person response agreement: subtables renumber by person group:
    Table 35.1-5 - plots for the entire sample or for the accumulated subsamples selected by PSUBTOTAL=
    Table 35.11-15, 35.21-25, ... - plots for subsamples selected by PSUBTOTAL=
    . Tables 37, 38, 39, 40, 41: subtable numberingKeyForm subtables renumbered for easy reference.
    Table 37. Person KeyForms of responses of persons to items. - Measure order. Was Table 17.3- Table 38. Person KeyForms of responses of persons to items. - Entry order. Was Table 18.3- Table 39. Person KeyForms of responses of persons to items. - Alphabetical order. Was Table 19.3- Table 40. Person KeyForms of responses of persons to items. - Misfit order. Was Table 7.2- Table 41. Person KeyForms of responses of persons to items. - Misfit order, only unexpected responses. Was Table 7.2.1-
    . Output files: IFILE=, PFILE= column headingsClarification of the abbreviated column headings for the observed correlations and the expected correlations in the IFILE= file-name and PFILE= file-name.
    PBSA = point-biserial correlation with all observations in the raw score. PBA-E is its expected value. PBSX = point-biserial correlation with the raw score excluding the current observation. PBX-E is its expected value. PTMA = point-measure correlation with the measure based on all observations. PMA-E is its expected value. PTMX = point-measure correlation with the measure based on all observations. PMX-E is its expected value.
    . Output file: XFILE= file name: observation statusThe analytical status of each observation is shown in the STATUS column of the XFILE=.
    0 = Missing (not administered), 1 = Standard, 2 = in Extreme person score, 3 = in Extreme item score, 4 = in Extreme person and item scores
    . Control instruction: BOXSHOW=No for Table layoutWhen BOXSHOW=No, boxed lines are not shown in Tables, so that they are easier to copy-and-paste into Excel and other software.
    . Control instruction: DATESHOW=No for Table headingWhen DATESHOW=No, the date of the analysis and the version of Winsteps are omitted from the Output Table headings.
    . Control instruction: IOFSFIELDS= field selection for IFILE= The fields displayed in the IFILE= item output file can be selected by IOFSFIELDS= or in the Output File Field Selection dialog box.
    . Control instruction: OFILE= report output file nameThe report output file can be specified in the Control File using OFILE= file name. This is useful with TFILE=.
    . Control instruction: POFSFIELDS= field selection for PFILE= The fields displayed in the PFILE= item output file can be selected by POFSFIELDS= or in the Output File Field Selection dialog box.
    . Control instruction: TCCFILE= file name: Test Characteristic CurveOutputs the plotting coordinates for the Ability Measure (theta), Test Characteristic Curve, Test Information Function and Standard Error of Measurement to TCCFILE= file.
    . Edit menu: Edit Initial Settings dialog box: Analysis Window: user-settable Font and Font size The default font in the Winsteps Analysis Window is usually Courier New, 15 points. You can change the font and font size in Edit Initial Settings Edit Initial Settings dialog box.
    . Excel/RSSST menu: Importing data from Excel file: remove trailing blanksExcel/RSSST menu, remove trailing fixed spaces when importing cell contents from Excel
    . Output Files menu: alphabetized The file types are listed alphabetically by control instruction in the Output Files menu.
    . Silent Install of Winsteps and MinistepInstructions for Silent Install of software
    Bug Fixes
    . Tables 3, 27, 28: summary statisticsCorrected summary statistics when items or persons are deleted or deslected from the Specification menu dialog box.
    . Tables 6, 10, 23, 24, etc.: sort orderWhen two persons or items have the same sort values (such as fit statistics or loadings), they are ordered by Entry number.
    . Tables 23.2 and 24.2: person and item clustersTable 23.2, etc., better selection of item clusters within item Contrasts, and Table 24.2, etc., better selection of person clusters within person Contrasts.
    . Tables 23.4 and 24.4, etc.: person/items interacting with clustersTable 23.4, etc., better selection of persons interacting with item clusters, and Table 24.4, etc., better selection of items interacting with person clusters
    . Tables 23.99 and 24.99, etc.: selection of correlated itemsTable 23.99,, better selection of highly correlated items, and Table 24.99, etc., better selection of highly correlated persons
    . Table 29: display of expected curvesTable 29.1, etc., corrected plotting of "expected" curves
    . Tables 30.1, 31.1, 33.1: Mantel or Mantel-HaenszelTable 31.1, etc., corrected column heading: Mantel-Haenszel for dichtomies, and Mantel for polytomies.
    . Excel/RSSST menu box: input data response frequenciesInput data from Excel, SPSS etc., correction of Excel and SPSS input-file problems, and bug in counting response frequencies,also
    WININPUT 3.72.3 at excelmod line: 10520 Error: 3EC Unable to set the ColumnWidth property of the Range class
    WININPUT: failure with big numeric tab-separated values (789) in line 12981
    . SPSS output files: file selectionOutput to SPSS etc., correction of file-selection problem.
    . Plotting with Excel: graph-typeExcel plots etc., correction Excel default-graph-type problem in Excel 2013.
    . Analysis Window closing dialog box: retain choice"Do you want to close all output windows for the closing analysis?" - actioned: "Yes, and from now on" and "No, and from now on"
    Security
    . Code signingCOMODO Digital Code Signing Certificate to verify publisher identity
    . Code execution protection Address Space Layout Randomisation (ASLR) and Data Execution Prevention (DEP) activated

      Winsteps 3.75 (October 20, 2012)

      ---------------------------------------------------------------------------------------------------
      |ENTRY   TOTAL  TOTAL           MODEL|   INFIT  |  OUTFIT  |PT-MEASURE |EXACT MATCH|              |
      |NUMBER  SCORE  COUNT  MEASURE  S.E. |MNSQ  ZSTD|MNSQ  ZSTD|CORR.  EXP.| OBS%  EXP%| TAP          |
      |------------------------------------+----------+----------+-----------+-----------+--------------|
      |     3     35     35   -6.59    1.85|      MINIMUM MEASURE|  .00   .00|100.0 100.0| 1-2-4        |
      |     4     32     35   -4.40     .81| .90    .0| .35   -.2|  .55   .53| 94.1  94.0| 1-3-4        |
      |     5     31     35   -3.83     .70|1.04    .2| .52    .1|  .55   .55| 88.2  91.7| 2-1-4        |

       
      With anchoring: IAFILE=* 4,10 *  
      ------------------------------------------------------------------------------------------------------------
      |ENTRY   TOTAL  TOTAL           MODEL|   INFIT  |  OUTFIT  |PT-MEASURE |EXACT MATCH|        |              |
      |NUMBER  SCORE  COUNT  MEASURE  S.E. |MNSQ  ZSTD|MNSQ  ZSTD|CORR.  EXP.| OBS%  EXP%|DISPLACE| TAP          |
      |------------------------------------+----------+----------+-----------+-----------+--------+--------------|
      |     3     35     35    7.62    1.85|      MINIMUM MEASURE|  .00   .00|100.0 100.0|    -.02| 1-2-4        |
      |     4     32     35   10.00A    .77| .81   -.3| .30   -.2|  .55   .53| 97.1  93.2|    -.24| 1-3-4        |
      |     5     31     35   10.37     .70|1.04    .2| .52    .1|  .55   .55| 88.2  91.7|    -.02| 2-1-4        |


      Table 36. PKMAP Kidmap output to Web Browser with ASCII=Webpage
      Winsteps histogram
      Histogram
    1. Enhancement: 1. Person-Item Histograms or Barcharts from Graphs Menu: much improved display produced with RealBasic/Xojo.
    2. Enhancement: 2. Table 23 (dimensionality). Inter-item-cluster ability correlation, Table 23.0 correlations
      Approximate relationships between the KID measures
       PCA      ACT       Pearson       Disattenuated Pearson+Extr  Disattenuated+Extr
      Contrast  Clusters  Correlation   Correlation   Correlation   Correlation
       1        1 - 3     0.1404        0.2175        0.1951        0.2923
       1        1 - 2     0.2950        0.4675        0.3589        0.5485
       1        2 - 3     0.8065        1.0000        0.8123        1.0000
       
    3. Enhancement: 3. EFILE= "expected scores on items" file (Reckase expected score scalogram). EFILE=
      ; EXPECTED SCORES FOR Knox Cube Test (Best Test Design p.31)
      MEASURE  SCORE      4      5     14     15     16     17
        -7.00    .11    .07    .04    .00    .00    .00    .00
        -6.85    .12    .08    .04    .00    .00    .00    .00
        -6.70    .14    .09    .05    .00    .00    .00    .00
        -6.55    .16    .10    .06    .00    .00    .00    .00
      .....
         7.70   5.74   1.00   1.00    .98    .92    .92    .92
         7.85   5.78   1.00   1.00    .98    .93    .93    .93
         8.00   5.81   1.00   1.00    .99    .94    .94    .94
      
    4. Enhancement: 4. Table 3.1, Table 27 (summary statistics). Counts of items with MAXIMUM SCOREs and MINIMUM SCOREs corrected Table 3.1 Table 27
    5. Enhancement: 5. Table 7.1, Table 11.1 (response strings). Reformatted and controlled by T7OPTIONS=OERZ Table 7.1 Table 11 T7OPTIONS=
    6. Enhancement: 6. DISFILE= (distractor file) headings corrected: "ALL" to "UNWTD", "USED" to "WTD" DISFILE=
    7. Enhancement: 7. Output files to Excel: EXCELNUMBER=Yes allows Excel to convert numerical-character labels into numbers EXCELNUMBER=
    8. Enhancement: 8. GRFILE= (ICC graphing file) bug squashed that omitted some items from the output file GRFILE=
    9. Enhancement: 9. ICORFILE=, PCORFILE= (inter-item and inter-person correlation matrices). Correlations to 6 decimal places instead of 4 decimal places. ICORFILE= PCORFILE=
    10. Enhancement: 10. IFILE=, PFILE= (item and person statistics). Heading word, "ERROR", changed to "MODLSE" or "REALSE" IFILE= PFILE=
    11. Enhancement: 11. XFILE= (response file) dialog box - allow multiple ranges for persons and items XFILE= dialog box
    12. Enhancement: 12. R-statistics interface: improved discovery of installed R-statistics software (if any): Edit Menu: Edit Initial Settings dialog box Edit Initial Settings
    13. Enhancement: 13. Files Menu: lists 30 most recently used Control Files File Menu
    14. Enhancement: 14. Files Menu: "Open File" opens in folder of most recently used Control File File Menu
      Winsteps 3.74 (4/16/2012)
    1. Enhancement: Tables 1, 12, 16: MORE=, LESS=, RARE=, FREQUENT= column headings
    2. Enhancement: Tables 27, 28 Subtotals: one-way ANOVA and fixed-effects chi-square for subtotals
    3. Enhancement: Tables 30.1, 31.1 DIF: show Observed-Expected Averages
    4. Enhancement: GRFILE= has 1000 points
    5. Enhancement: IPMATRIX "Measure Difference" shown with 4 decimal places
    6. Enhancement: TABLES= from the Specification menu dialog box
    7. Enhancement: UEXTREME=Yes include extreme scores when centering person or item measures
    8. Enhancement: XFILE= shows response-weight and more-probable response
    9. Enhancement: Graph window: Test Characteristic Curve has 1001 points
    10. Bug fix: Table 14.1 etc. better estimate of upper asymptote for items with extreme scores
    11. Bug fix: Table 14.3 and DISFILE=. computations of Outfit Mean-square now agree
    12. Bug fix: IPMATRIX= fixed length output: invalid character near column 500
    13. Bug fix: program crash formatting large numbers for output
    14. Bug fix: program crash formatting long lines for screen output
    15. Bug fix: program crash during "Reading Control Variables" for IVALUE= without IREFER=
    16. (4/19/2012) Bug fix: IFILE=, PFILE= to SPSS .sav file: incorrect column headings for InMnZemp, InMnZstd, OutMnZemp, OutMnZstd
      Winsteps 3.73 (12/5/2011)
    1. Enhancement: PMAP=N IMAP=N options to display entry numbers on variable maps
    2. Enhancement: Table 3.1: Capped Binomial Deviance for Dichotomous items
    3. Enhancement: immediate verification that input files exist
    4. Clarification: "Andrich Threshold" heading in Table 3.2
    5. Bug fix: EDFILE= file1+file2 did not work
    6. Bug fix: EDFILE= error message for persons or items with 0 or negative entry numbers
    7. Bug fix: UCOUNT= high number crash
    8. Bug fix: PMAP=M crash
    9. Bug fix: Diagnosis Menu: add Table numbers and display correct Tables.
    10. Bug fix: wrong working directory for DATA= at the Extra prompt: corrected to the current working directory.
    11. Bug fix: program crash when writing long error messages
    12. Bug fix: text fits in buttons of graphical bar-chart window (Graphs menu)
    13. Bug fix: display correct estimated item discrimination for zero-weighted items
    14. Bug fix: expression evaluation, e.g., SAFILE=* 1 -1-1 * should be -2
    15. Bug fix: MFORMS= failure at 640 files
      Winsteps 3.72 (5/5/2011) 3.72.2 (5/31/2011) 3.72.3 (8/1/2011)
    1. 3.72.3.1 Bug fix: Corrected failure with TFILE=* 6.4 * or TFILE=* 10.4 *
    2. 3.72.3.1 Bug fix: Corrected incorrect sub-table selection with TFILE=* 1.10 *
    3. 3.72.3 Bug fix: Table 0.2 etc. can be output with TFILE=
    4. 3.72.3 Bug fix: Table 3.2, etc.: ISRANGE= for multiple item groups
    5. 3.72.3 Bug fix: Tables 30.1: Corrected computation of Mantel and Mantel-Haenszel chi-squares and Liu-Agresti cumulative log-odds ratio.
    6. 3.72.3 Bug fix: Table 33: DIF=* (list) * and DPF=* (list) * supported.
    7. 3.72.3 Bug fix: Table 36: Colored PKMAP= display correctly in Firefox browser
    8. 3.72.3 Enhancement: Output files: IFILE=, PFILE=, DISFILE= output 4 decimal places with variable-length fields
    9. 3.72.3 Enhancement: Output files to .sav: SPSS print defaults for numbers now have 4 decimal places
    10. 3.72.3 Bug fix: Plots: DIF plot now blank for missing comparisons
    11. 3.72.3 Bug fix: Excel/RSSST: file conversion failure due to Windows bug
    12. 3.72.2 Enhancement: replace ASCII control characters in data file by blanks
    13. 3.72.2 Bug fix: improved half-rounding of integer output
    14. 3.72.2 Bug fix: UDECIM= applied to Table 3.1
    15. 3.72.2 Bug fix: Corrected item weighting when PTBISERIAL=EXCLUDE
    16. 3.72.1 Bug fix: Long output lines with ASCII=Web or ASCII=Doc not truncated
    17. Enhancement: Table 36 and PKMAP= supports formatting options, sorting, and selecting based on fit size, (replaces KIDMAP=).
    18. Enhancement: Table 35 and AGREEFILE=, option to only compare within PSUBTOTAL= person classification-groups
    19. Enhancement: ASCII=Doc outputs Tables in HTML to Microsoft Word or equivalent.
    20. Enhancement: IPRFILE= supports response recoding for blocks of persons and items in the input data
    21. Enhancement: OUTFIT = Both (infit and outfit) or Yes, Outfit = Infit or No, Outfit = Outfit, for misfit sort order (descending)
    22. Enhancement: Make Winsteps foreground window active when user action needed
    23. Enhancement: Graph window - Graphing of categories: add more sliders for fine-adjustment of x- and y-axes
    24. Bug fix: Bubble chart failure if other action performed simultaneously.
    25. Bug fix: Program crash due to very long control statements causing internal buffer overflow
    26. Bug fix: CODES= maximum is 255 codes. Too many codes were not detected, causing program crash.
    27. Bug fix: ; GROUPS = 0 is now a comment in Excel/RSSST data file conversion to Winsteps format
    28. Bug fix: EQFILE= no longer ignored nor misinterpreted
    29. Bug fix: IDELETE=+1 and PDELETE=+1 correctly delete all other items or persons
    30. Bug fix: PDFILE= selection now also done correctly from "Specification" menu
      Winsteps 3.71.0 (1/30/2011) : PDF showing major enhancements
    1. Bug fix:(3.71.0.1 - 2/1/2011): ASCII=webpage mis-formats
    2. Major Enhancement: Table 36 Person diagnostic KIDMAPs
    3. Major Enhancement: Table 35 Paired-person response agreement (cheating detection) and AGREEFILE= showing agreement-counts between person pairs.
    4. Major Enhancement: SFUNCTION= and ISRANGE= for polynomial smoothing, interpolation and extrapolation of Rasch-Andrich thresholds
    5. Enhancement: file=? opens the Browser window: e.g., SFILE=? and SAFILE=?
    6. Enhancement: Graph window: more arrows for fine-tuning the x-axis and the y-axis.
    7. Bug fix: Tables 17.3 etc. sometimes not displayed
    8. Bug fix: Duplicate error messages for missing files
    9. Bug fix: Correct SAFILE= values reported as incorrect: "SAFILE= is in wrong format. Expecting second number or number-number"
    10. Bug fix: Excel/SSSSR - SPSS .sav input file conversion: long variable name omitted for first item.
      Winsteps 3.70.1 (12/1/2010)
    1. Enhancement: (3.70.1.1 - 12/5/2010): accomodate change in R Statistics version 2.12
    2. Enhancement: (3.70.1.1 - 12/5/2010): Tables 27 and 28, display progress bar on Winsteps analysis screen
    3. Enhancement: CURVES= selects curve-type for Table 21 only
    4. Enhancement: ISFILE= report Rasch-Andrich threshold S.E. for all thresholds
    5. Enhancement: T2SELECT= to select the sub-tables of Table 2 for display
    6. Enhancement: TFILE= Table 0 can be specified or omitted
    7. Enhancement: TFILE= individual sub-tables can be specified
    8. Enhancement: XFILE= column for "More Probable Response"
    9. Enhancement: Excel/RSSST: allow tab, comma and semi-colon -separated text-tab input files
    10. Enhancement: Initial values file (Winsteps.ini) in Windows "Application Data" folder, not Winsteps folder.
    11. Bug fix: Excel/RSSST menu: prevent crash displaying text-tab files
    12. Bug fix: Output Tables menu: report all sub-tables for Table 2. and Table 3.2 etc.
    13. Bug fix: Subsets: prevent false reporting of subsets with rating scales
      Winsteps 3.70.0 (7/1/2010)
    1. Bug fix:(3.70.0.5 - 10/12/2010): Report reliability/separation for including extreme scores
    2. Bug fix:(3.70.0.5 - 10/12/2010): Analysis screen: show total score summary with reliability/separation for including extreme scores
    3. Bug fix:(3.70.0.5 - 10/12/2010): Allow item and category ranges: anchor file format
    4. Bug fix:(3.70.0.4 - 9/18/2010): Incorrect subset reporting with person/item anchors
    5. Change: (3.70.0.3 - 9/7/2010): XMLE= discontinued due to poor performance
    6. Change: (3.70.0.3 - 9/7/2010): Wording change: Raw score "test" reliability in Table 3.1
    7. Bug fix:(3.70.0.3 - 9/7/2010): Sort failure when tables output in unusual order
    8. Bug fix:(3.70.0.3 - 9/7/2010): "MISMATCH" failure, detected by self-check in the data-compression routine
    9. Bug fix:(3.70.0.2 - 7/5/2010): Standard Deviations can be slightly inaccurate due to loss of floating-point precision
    10. Bug fix:(3.70.0.1 - 7/5/2010): Explicit "Average Ability" in distractor table
    11. Bug fix:(3.70.0.1 - 7/5/2010): Excel reformating labels like 123E45 as floating point numbers
    12. Bug fix:(3.70.0.1 - 7/5/2010): different subsets reported for the same response string
    13. Bug fix:(3.70.0.1 - 7/5/2010): Default to launch .txt, xls, .sav files with Windows "open" default
    14. Bug fix:(3.70.0.1 - 7/5/2010): "Person codes write failure" when using EDFILE= with no DATA=
    15. Bug fix:(3.70.0.1 - 7/5/2010): "MISMATCH" failure, detected by self-check in the data-compression routine
    16. Bug fix:(3.70.0.1 - 7/5/2010): "85" error (or crash on launch) when opening invalid output files
    17. Enhancement: Tables 31, 32: within-group/between-group fit statistics reported
    18. Enhancement: Increased Windows 7 compatibility: routine Winsetup-exe renamed Windata-exe
    19. Enhancement: Scatterplot dialog box: include Entry number and RMS residual fields for plotting
    20. Enhancement: IFILE=, PFILE= default is to include all fields. Omit fields with "Output Files", "Select Fields"
    21. Enhancement: Allow LOADJ= as well as LOWADJ=
    22. Enhancement: Format output files for ConstructMap 5.4
    23. Enhancement: PFILE= and IFILE= default is no ";" for extreme scores (reset with Output Files, IFILE=, File selection)
    24. Enhancement: Table 14.3 "AVERAGE MEASURE" clarified to "AVERAGE ABILITY"
    25. Bug fix: Floating point numbers correctly decoded: tested with 1e-4 2d+2 1.14e1 1.24d2
    26. Bug fix: Transposed file: CODES=, trailing blanks truncated
    27. Bug fix: winsetup-exe changed to windata-exe to avoid Windows UAC error
    28. Bug fix: tweaking of data-connectivity "subset" algorithm for indirect connections and anchoring
    29. Enhancement: subset reporting in Table 0.2
      Winsteps 3.69.1 (12/31/2009)
    1. Failure in Excel plotting: "Excel-related error in WINEXCEL 3.69.115 at bubblevb 12870:-2147024809 This object has no title."
      Solution: this is due to changes in Excel, so please update to a later version of Winsteps.
    2. Bug fix:(3.69.1 - 12/31/2009): person labels sometimes reported incorrectly in 3.69.0
    3. Bug fix:(3.69.1 - 12/31/2009): missing data sometimes reported incorrectly in 3.69.0
    4. Bug fix:(3.69.1 - 12/31/2009): incorrect processing of R-Statistics data files
    5. Bug fix (3.69.1.1 - 1/4/2010): occasional crash or hang in "subset probe" routine
    6. Bug fix (3.69.1.1 - 1/4/2010): failure to delete temporary files
    7. Bug fix (3.69.1.2 - 1/12/2010): Table 3: VALID RESPONSES: 99.9% incorrectly shown when there are 100% valid responses
    8. Bug fix (3.69.1.2 - 1/12/2010): Tables 23 and 24: small corrections to computation of "explained" and "unexplained" variance terms
    9. Bug fix (3.69.1.2 - 1/12/2010): corrected link to Help from the Specification Menu dialog box
    10. Bug fix (3.69.1.2 - 1/12/2010): recovery from inaccessible Windows temporary folder: "Windows temporary folder failure"
    11. Bug fix (3.69.1.3 - 1/14/2010): occasional scatterplot failure when selecting IFILE/PFILE
    12. Bug fix (3.69.1.4 - 1/18/2010): Table 2: 5 digit item numbers displayed in full, not as ****
    13. Bug fix (3.69.1.4 - 1/18/2010): Tab-separated number failure: Value problem in IREFER=*: 1-D
    14. Bug fix (3.69.1.4 - 1/18/2010): Failure reading control files with very long, incorrect, control instructions
    15. Bug fix (3.69.1.4 - 1/18/2010): Clearer error message for "unexpected end of file"
    16. Bug fix (3.69.1.4 - 1/18/2010): Graph screen: occasional incorrect labeling of distractor/option curves
    17. Bug fix (3.69.1.4 - 1/18/2010): Graph screen: occasional appearance of bogus distractor/option curves
    18. Bug fix (3.69.1.5 - 1/25/2010): Tables 6, 10: "better fitting omitted" line printed
    19. Bug fix (3.69.1.5 - 1/25/2010): Tables 6, 7, 10, 11: misfit sort-order improved
    20. Bug fix (3.69.1.5 - 1/25/2010): Tables 3.1, 27, 28: TOTALSCORE=YES actioned to display total scores (with extreme scores)
    21. Bug fix (3.69.1.5 - 1/25/2010): crash on CODES= over 1,000 characters. CODES= up to 4,000 characters now allowed
    22. Bug fix (3.69.1.6 - 2/1/2010): copy-and-paste from Winsteps analysis screen fails. Clipboard locks up
    23. Bug fix (3.69.1.7 - 2/3/2010): remove superfluous (green) line from Excel DIF and DPF plots.
    24. Bug fix (3.69.1.8 - 2/27/2010): incorrect function of EDFILE= with large files
    25. Bug fix (3.69.1.8 - 2/28/2010): control file failure with SPFILE=
    26. Bug fix (3.69.1.9 - 3/10/2010): correction so that STBIAS=YES with anchor values produces same estimates as earlier versions
    27. Bug fix (3.69.1.10 - 3/20/2010): correction so that SAFILE= anchors ISGROUPS= rating-scales
    28. Bug fix (3.69.1.11 - 3/28/2010): correction to webpage display and open/save file boxes
    29. Bug fix (3.69.1.12 - 3/31/2010): allow silent install: correction to allow long simulated data records
    30. Bug fix (3.69.1.13 - 4/1/2010): correction to minimum counts and scores for "extreme+non-extreme" persons in Table 3.1
    31. Bug fix (3.69.1.14 - 4/14/2010): Ctrl+F to skip out of Probing Connection and also Table 23
    32. Bug fix (3.69.1.14 - 4/14/2010): Headings "Total" or "Non-extreme" in measure and score tables
    33. Bug fix (3.69.1.14 - 4/14/2010): crash with IDELETE= and IDFILE= and item number bigger than NI=
    34. Enhancement (3.69.1.15 - 5/3/2010): Table 33 - DGF. Add DGF SCORE columns and improve sort order.
    35. Enhancement (3.69.1.15 - 5/3/2010): DIF/DPF/DGF Plots. Add "Average Score-points" plot.
    36. Enhancement (3.69.1.15 - 5/3/2010): Graph window: Multiple ICCs: Select All Model ICCs and Select All Empirical ICCs
    37. Bug fix (3.69.1.15 - 5/3/2010): remove inoperative "Close Open Windows" from Files menu
    38. Bug fix (3.69.1.15 - 5/3/2010): correct functioning of CUTLO= CUTHI= for data trimming
    39. Bug fix (3.69.1.15 - 5/3/2010): iteration screen: reported size of maximum category residual
    40. Bug fix (3.69.1.16 - 5/23/2010): Table 20: omitted first digit if very long number output.
    41. Bug fix (3.69.1.16 - 5/23/2010): Table 20 + SCFILE=: eliminate very small numerical differences.
    42. Bug fix (3.69.1.16 - 5/23/2010): Table 3.1: valid observation % is approximate
    43. Bug fix (3.69.1.16 - 5/23/2010): "mismatch" error with missing data and NI= > 255
    44. Bug fix (3.69.1.16 - 5/23/2010): Graph window - Graphing: after Multiple ICCs: Index out of bounds
      Winsteps 3.69.0 12/29/2009 : PDF showing all 39 changes
    1. Up to 9,999,999 persons and 64,000 items. Relatively faster processing and relatively smaller disk requirements. For example, a test analysis took 8 days in Winsteps 3.68, 8 days, but only 8 hours in Winsteps 3.69.
    2. More compact input-data-files for sparse data: EDFILE=.
    3. Convenient data conversion from Excel, R, SAS, SPSS, STATA data files.
    4. Singular-Value-Decomposition, SVD, of residuals - for investigating multidimensionality
    5. Root-mean-square residuals, RMSR, reported
    6. Many minor enhancements and bug-fixes
      Winsteps 3.68.2 04/20/2009
    1. Last version of Winsteps for pre-2000 PCs and Windows: pre-Pentium-4 PCs and Windows 98SE, NT, ME
    2. Bug fix: crash with large plots in Excel 2007
    3. Graphic barchart: user-adjustable alignment of sides of lower box
    4. Winsteps: rare memory crash
    5. Bug fix: SPSS 17 file access problem
    6. Bug fix: Graphs - black selection boxes mispositioned when curve is selected
      Winsteps 3.68.1 02/18/2009
    1. Tables 27.1, 28.1: Welch t-test for 2 subtotals reinstated. Omitted in 3.68.0.
      Winsteps 3.68.0 02/15/2009 : PDF showing all 12 changes
    1. 12 enhancements and bug-fixes including:
    2. Person-item distribution bar-chart, shown →
    3. Reliability of mean sub-total measures reported
    4. Immediate display of output files with FSHOW=Yes
    5. Modules updated to accord with Microsoft Security Alert
      Winsteps & Microsoft 12-2008
    1. Security update for modules that are used in Winsteps, Facets, Ministep, Minifac, Bond&FoxSteps
    2. This is in addition to the Windows Update.
    3. Please be sure that your anti-virus software is active and up-to-date.
    4. Please perform the cumulative security update (10MB) from Microsoft: https://support.microsoft.com/kb/957924/
      Winsteps 3.67.0 11/26/2008 : PDF showing all 27 changes
    1. 27 enhancements and bug-fixes including:
    2. Output file formats for Excel, R statistics, SPSS, webpages and text files
    3. SIFILE= simulation files: resampling option
    4. Table 1 variable map: width adjustable with LINELENGTH= allows for longer labels to be displayed
    5. Edit menu: Edit initial settings: Default value of any control variable can be specified
    6. Edit menu: reformatted data file (after FORMAT=) can be displayed
      Winsteps 3.66.0 9/2/2008 : PDF showing all 35 changes
    1. 35 enhancements and bug-fixes including:
    2. Expected values of correlations: Tables 6, 10, 13, 14, 15, 17, 18, 19: Point-biserial correlations: observed and expected values
    3. Total score now the default (TOTALSCORE=Yes): Tables 6, 10, 13, 14, 15, 17, 18, 19: total score is the default, not the score less extreme response strings
    4. Welch's t-test: Table 30: DIF significances computed with Welch's improved version of Student's t-test
    5. Percentiles: Tables 2, 20, 27, 28: Percentiles shown under distributions
    6. Data editing: EDFILE= selective editing of input data
    7. Excel scatterplot: computations of correlations; user-settable confidence bands
      Winsteps 3.65.0 4/3/2008 : PDF showing all 31 changes
    1. 31 enhancements and bug-fixes including:
    2. All Tables: prettier display options: drawing characters and web-page format
    3. Automatic display of output Tables specified in control file
    4. Tables 23, 24: Variance explained by persons and also by items based on raw residuals not standardized residuals
    5. Tables 30, 31, 33: DIF computation for extreme scores now regularized
    6. SIFILE= simulations now with user-specified seed and multiple file options
    7. Graph window: display Legend button
    8. Help: now Vista-compatible HTMLHelp
      Winsteps 3.64.2 11-6-2007 : PDF showing all 11 changes
    1. Enhancement: STATA added to EXCEL/SAS/SPSS interface. Also conversion of STATA/EXCEL/SAS/SPSS to tab-separated format
    2. Enhancement; PSELECT=, ISELECT=, omission with ~
    3. Enhancement: analysis window can be saved and edited
    4. Bug fix: Tables 1.3, 16.3: M,S,T on wrong side of vertical axis
    5. Bug fix: Table 14.1, etc.: formatting large numbers
    6. Bug fix: Table 14.3, etc.: number formatting problem and improved accuracy
    7. Bug fix: Tables 27, 28: do not report subtotal tables with all zeroes
    8. Bug fix: Tables 3, 27, 28: inestimable correlations reported as 0, not -1.
    9. Bug fix (later): Tables 23, 24: program crash with ISGROUPS=
      Winsteps 3.64.1 9-24-2007
    1. Clarification of EXCEL/SAS/SPSS interface: simplified process, improved Help and more robust processing
      Winsteps 3.64.0 9-18-2007 : PDF showing all 11 changes
    1. Enhancement: Improved data-input from Excel files.
    2. Enhancement: DIF summary chi-squares in Tables 30.4, 31.4
    3. Enhancement: more transposed-file output options
    4. Enhancement: installation checks for existing SPSS interface
    5. Enhancement: Vista-compatible ".chm" help
    6. Bug fix: Graphs - "copy graph to clipboard" functions
    7. Minor bug fixes and cosmetic improvements
      Winsteps 3.63.2 7-2-2007
    1. Enhancement: Table 30, 31, 33: checkbox to include or exclude extreme scores in DIF/DPF computations
    2. Bug fix: SIFILE= simulated data file: random numbers seeded with current system time
    3. Bug fix: DISFILE= distractor file: calculation of missing data percent corrected
    4. Bug fix: Windows clipboard always released
    5. Compatibility: huge file handling (64-bit) in Windows XP, Vista
      Winsteps 3.63.1 1-30-2007
    1. Bug fix: winsetup-exe - data setup routine: missing menu entries
      Winsteps 3.63.0 10-19-2006
    1. Enhancement: Add non-uniform DIF to Graph menu.
    2. Enhancement: Display nonuniform DIF Graph
    3. Enhancement: Empirical curves: choice of points, lines and points+lines Lines, not points: Click for points, lines, points+lines : Winsteps Output
    4. Enhancement: Limit ZSTD to d.f. >=1. To largely avoid counterintuitive ZSTD values. Very low mean-square with positive zstd is counterintuitive. It results from meaninglessly small d.f. Prevent computational d.f. falling below 1.0
    5. Enhancement: XFILE= usersettable decimal places
    6. Enhancement: XFILE= kurtosis of expectation around observation.
    7. Enhancement: XFILE= Residual file. Fixed fields always separated with a blank space. Fields abut. Fields separate
    8. Enhancement: Subset reporting: On-screen reporting and report output file Incomplete details: Full details:
    9. Enhancement: Subset reporting included on measure tables No subset information Subset information
    10. Enhancement: Table 20: Prediction of scores from measures and vice-versa Minimal details:
    11. Bug fix: Tables 23, 24. Occasional garbage characters in Tables.
    12. Bug fix: RFILE= crash with long item names No failure
    13. Bug fix: Table 20. Score table conversion factors incorrectly computed UMEAN= USCALE= Incorrect values: Correct values:
    14. Bug fix: UASCALE= can malfunction when UMEAN<>0.
      IAFILE=*
      2 400 ; item 2 anchored at 400
      *
      UASCALE=100
      UMEAN=500
      USCALE=100
      UANCHOR=Yes
      Anchored value reported as 900 <= incorrect
      IAFILE=*
      2 400 ; item 2 anchored at 400
      *
      UASCALE=100
      UMEAN=500
      USCALE=100
      ; UANCHOR= no longer required. Assumed when
      UASCALE= is used.
      Anchored value reported as 400 <= correct
    15. Enhancement: Task bar caption identifies analysis Task bar does not show control file: Task bar shows control file:
    16. Enhancement: Task bar caption: user-settable No user-setting option: Task bar user-settable:
    17. Enhancement: Faster initial installation 15 seconds, now 1 second
    18. Bug fix: Open file sometimes doesn't respond with Control File box File name enter-key is sometimes ignored: File dialog box appears:
    19. Bug fix: GROUPS= occasional crash
    20. Enhancement: Paste one multiple character cell into adjacent cells, one character per cell Only first character pasted: Choice of first or all characters:
    21. Bug fix: NAMELEN= ignored
    22. Bug fix: Labels displayed with surrounding quotes.
    23. Bug fix: ISGROUPS= longer than observed response string allowed. If ISGROUPS= is longer than observed response string, Winsteps Data Setup crashes
    24. Enhancement: Plotting with Excel 2007 Beta supported. Note: Excel 2007 Beta lacks some capabilities
    25. Enhancement: non-uniform DIF graphs
    26. Enhancement: user-settable decimal places on XFILE=
      Winsteps 3.62.1 8-6-2006 (roughly matches Bond&FoxSteps, Bond & Fox, 2edn.)
    1. Enhancement: PTBIS=Y excludes current response from total score. PTBIS=A includes all responses in total score. PTBIS=M measure-based correlation
    2. Bug fix: occasional crash when writing PFILE= or IFILE=
      Winsteps 3.62.0 7-28-2006
    1. Enhancement: Distractor file: percents computed for non-missing categories ignoring missing.
    2. Bug fix: point-biserials reported as zero for deletes and extreme scores
    3. Bug fix: SPSS labels: 64-character labels reported, requires use of your own spssio32.dll
    4. Enhancement: DPF, DIF reported for extreme scores
    5. Bug fix: mean measures shown on report screen (instead of blank space)
    6. Enhancement: Table 2 more informative with many categories
    7. Bug fix: Data setup module does not cause Winsteps window to close
    8. Enhancement: Excel bubble plot - remove annoying text box
    9. Enhancement: Rasch-Thurstone thresholds identified in Table 2
    10. Bug fix: Outfit standardized t-statistics corrected for very small d.f.
    11. Bug fix: Chart=Yes display corrected for missing "|"
    12. Bug fix: Enter key sometimes ignored (requires multiple presses to work)
    13. Enhancement: Diagnosis menu: person misfit added
      Winsteps 3.61.1 5-22-2006
    1. Bug fix: !!SPSS failure during SPSS file conversion
      Winsteps 3.61.0 5-17-2006
    1. Enhancement: choice of indicators (international): decimal points and decimal commas etc.
    2. Enhancement: choice of heading lines, separators and quoted character fields on output files
    3. Enhancement: distractor point-measure correlations exclude missing responses
    4. Enhancement: Excel plots - names and titles improved (Plot 30, 31, 33) DIF, DPF, DGF display
    5. Enhancement: allow longer SPSS variable names
    6. Enhancement: user scaling calculator (Help menu)
    7. Enhancement: Tables 30, 31, 33: improved DIF estimates for extreme scores.
    8. Precautionary: hex code "A0" as blank
    9. Precautionary: set topmost temporarily option - done
    10. Precautionary: remove confusing "yardstick" index from variance-explained reports
    11. Precautionary: detect non-ASCII text files (UTF- etc.)
    12. Precautionary: "Distracter" spelt "Distractor"
    13. Precautionary: Table 30.1, 31.1, 33.1, 33.3: all paired comparisons listed explicitly
    14. Precautionary: Table 30.3, 31.3: item/person within class
    15. Precautionary: PCAR loadings shown in two adjacent columns - to emphasize they are equally important
    16. Precautionary: specification pull-down box: "OK and again" added.
    17. Precautionary: right-click to move dialog boxes (for low screen resolutions)
    18. Help: how to change screen resolution
    19. Help: Double precision is good to 700 logits! (single to 90 logits)
    20. Bug: fix automatic screen close
    21. Bug: fix size of selection box on graphs
    22. Bug: fix occasional memory overwrite for Table 33
    23. Bug: fix Table 11 crash when XMLE=Yes
    Winsteps+Facets small CD-ROM
    Winsteps+Facets small CD-ROM
    original Bigsteps Diskette
    Original Bigsteps diskette.
    Bigsteps was distributed by MESA Press.

    Go to Top of Page
    Go to Winsteps & Facets home Page

    Facets Rasch measurement software. Buy for $149. & site licenses. Freeware student/evaluation Minifac download
    Winsteps Rasch measurement software. Buy for $149. & site licenses. Freeware student/evaluation Ministep download

    Rasch Books and Publications
    Invariant Measurement: Using Rasch Models in the Social, Behavioral, and Health Sciences, 2nd Edn, 2024 George Engelhard, Jr. & Jue Wang Applying the Rasch Model (Winsteps, Facets) 4th Ed., Bond, Yan, Heene Advances in Rasch Analyses in the Human Sciences (Winsteps, Facets) 1st Ed., Boone, Staver Advances in Applications of Rasch Measurement in Science Education, X. Liu & W. J. Boone Rasch Analysis in the Human Sciences (Winsteps) Boone, Staver, Yale
    Introduction to Many-Facet Rasch Measurement (Facets), Thomas Eckes Statistical Analyses for Language Testers (Facets), Rita Green Invariant Measurement with Raters and Rating Scales: Rasch Models for Rater-Mediated Assessments (Facets), George Engelhard, Jr. & Stefanie Wind Aplicação do Modelo de Rasch (Português), de Bond, Trevor G., Fox, Christine M Appliquer le modèle de Rasch: Défis et pistes de solution (Winsteps) E. Dionne, S. Béland
    Exploring Rating Scale Functioning for Survey Research (R, Facets), Stefanie Wind Rasch Measurement: Applications, Khine Winsteps Tutorials - free
    Facets Tutorials - free
    Many-Facet Rasch Measurement (Facets) - free, J.M. Linacre Fairness, Justice and Language Assessment (Winsteps, Facets), McNamara, Knoch, Fan
    Other Rasch-Related Resources: Rasch Measurement YouTube Channel
    Rasch Measurement Transactions & Rasch Measurement research papers - free An Introduction to the Rasch Model with Examples in R (eRm, etc.), Debelak, Strobl, Zeigenfuse Rasch Measurement Theory Analysis in R, Wind, Hua Applying the Rasch Model in Social Sciences Using R, Lamprianou El modelo métrico de Rasch: Fundamentación, implementación e interpretación de la medida en ciencias sociales (Spanish Edition), Manuel González-Montesinos M.
    Rasch Models: Foundations, Recent Developments, and Applications, Fischer & Molenaar Probabilistic Models for Some Intelligence and Attainment Tests, Georg Rasch Rasch Models for Measurement, David Andrich Constructing Measures, Mark Wilson Best Test Design - free, Wright & Stone
    Rating Scale Analysis - free, Wright & Masters
    Virtual Standard Setting: Setting Cut Scores, Charalambos Kollias Diseño de Mejores Pruebas - free, Spanish Best Test Design A Course in Rasch Measurement Theory, Andrich, Marais Rasch Models in Health, Christensen, Kreiner, Mesba Multivariate and Mixture Distribution Rasch Models, von Davier, Carstensen
    As an Amazon Associate I earn from qualifying purchases. This does not change what you pay.

    facebook Forum: Rasch Measurement Forum to discuss any Rasch-related topic

    To receive News Emails about Winsteps and Facets by subscribing to the Winsteps.com email list,
    enter your email address here:

    I want to Subscribe: & click below
    I want to Unsubscribe: & click below

    Please set your SPAM filter to accept emails from Winsteps.com
    The Winsteps.com email list is only used to email information about Winsteps, Facets and associated Rasch Measurement activities. Your email address is not shared with third-parties. Every email sent from the list includes the option to unsubscribe.

    Questions, Suggestions? Want to update Winsteps or Facets? Please email Mike Linacre, author of Winsteps mike@winsteps.com


    State-of-the-art : single-user and site licenses : free student/evaluation versions : download immediately : instructional PDFs : user forum : assistance by email : bugs fixed fast : free update eligibility : backwards compatible : money back if not satisfied
     
    Rasch, Winsteps, Facets online Tutorials

    Coming Rasch-related Events: Winsteps and Facets
    Oct 21 - 22 2024, Mon.-Tues. In person workshop: Facets and Winsteps in expert judgement test validity - UNAM (México) y Universidad Católica de Colombia. capardo@ucatolica.edu.co, benildegar@gmail.com
    Oct. 4 - Nov. 8, 2024, Fri.-Fri. On-line workshop: Rasch Measurement - Core Topics (E. Smith, Winsteps), www.statistics.com
    Jan. 17 - Feb. 21, 2025, Fri.-Fri. On-line workshop: Rasch Measurement - Core Topics (E. Smith, Winsteps), www.statistics.com
    May 16 - June 20, 2025, Fri.-Fri. On-line workshop: Rasch Measurement - Core Topics (E. Smith, Winsteps), www.statistics.com
    June 20 - July 18, 2025, Fri.-Fri. On-line workshop: Rasch Measurement - Further Topics (E. Smith, Facets), www.statistics.com
    Oct. 3 - Nov. 7, 2025, Fri.-Fri. On-line workshop: Rasch Measurement - Core Topics (E. Smith, Winsteps), www.statistics.com


    Our current URL is www.winsteps.com

    Winsteps® is a registered trademark
     

    The URL of this page is www.winsteps.com/wingood.htm