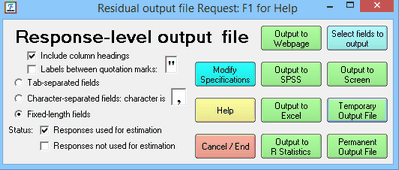
From the Output Files menu, clicking on Residuals/Response Output file. A file of residuals from the main analysis is produced. This file is designed for input into other programs with one line per measurable observation. It can be used for calculating other fit statistics and producing specialized diagnostic reports. Also produced by Residualfile=.

For help with this dialog box, see Output Dialog Box.
Heading lines= control the output of the heading line. CSV= allows tab-delimited and other formats. QM quotation marks, controls whether labels are within quotation marks.
Output to SPSS, Excel and R Statistics are in their native-format. Excel and R Statistics are launched.
Modify specifications lets you change the values of some basic output settings
Status: Responses used for estimation: report responses used for estimation (Status code: 1, 2)
Responses not used for estimation: report responses not used for estimation (Status code: -5, -4 , -3, -2, -1)
Output directly to Excel and into an SPSS .sav file are supported.
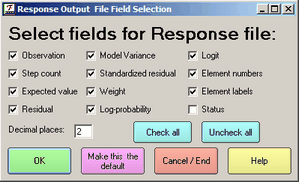
Select fields to output lets you choose which fields you want to display:

If "Make this the default" is ignored, then you need to take ownership of file Facets.ini in your c:\Facets folder. See www.addictivetips.com/windows-tips/windows-7-access-denied-permission-ownership
Here is an example of the format with 4 decimal places in the "Select fields" dialog box. The precise format depends on the number of facets in your data:
Obs Stp Exp Res Var StRes Wt LProb Measure Displ Status MPCat E1 E2 M1 M2 Children Tapping_it
1 1 .97 .03 .02 .16 1.00 -.03 3.66 1.03 2 1 1 1 -2.98 -6.64 Boy 1-4
1 1 .97 .03 .02 .16 1.00 -.03 3.66 1.03 2 1 1 2 -2.98 -6.64 Boy 2-3
The columns are:
Fixed field columns |
Abbreviation |
Description |
|
1-10 |
Obs |
response as observed in the data file |
|
11-20 |
Stp |
observed response as renumbered into a count of ordered steps |
|
21-30 |
Exp |
expected score for this response (decimal places set in selection dialog box) |
|
31-40 |
Res |
score residual: (observed Stp - expected Exp) |
|
41-50 |
Var |
model variance of observed score around the expected score for this response, the statistical information in this response |
|
51-60 |
StRes |
standardized residual: residual / sqrt (variance) |
|
61-70 |
Wt |
weighting (model weight * observation weight * item weight) |
|
71-80 |
LProb |
natural logarithm of the probability of the observation |
|
81-90 |
Meas |
sum of the measures of the elements producing the observation. User-scaled: Meas = sum(element measures - umean) + umean |
|
91-100 |
Disp |
displacement = measure residual = (score residual / variance)*(user-scaling). The measure of element 1 according to this observation is "element measure" for element + "displacement" * (orientation of facet 1). This is limited to the range -10 to +10 logits. |
|
101-110 |
Status |
Status Code |
Meaning |
-6 (not used for estimation) |
Response in two multiple-observation ranges, such as 1_4, 2-6,... |
||
-5 (not used) |
Responses after end-of-file. |
||
-4 (not used) |
Responses only in extreme scores. |
||
-3 (not used) |
Responses with invalid elements. Elements for these observations are not defined. See Table 2. |
||
-2 (not used) |
Responses in two extreme scores |
||
-1 (not used) |
Responses invalid after recounting A dichotomy or rating scale has less than two categories, so it cannot be estimated. |
||
1 (used for estimation) |
Responses used for estimation |
||
2 (used) |
Responses in one extreme score |
||
111-120 |
MPCat |
most probable category to be observed. If two categories are equally probable, then the higher category is shown here |
|
121-130 |
E(facet number) |
element number for facet 1 or null element, usually 0 |
|
| |
|
||
| |
M(facet number) |
element measure for facet 1 from Table 7 (user-scaled) |
|
| |
|
||
| |
(facet label) |
element label for facet 1 |
|
| |
|
||
For "Category implies Measure" (C->M) and "Measure implies Category" (M->C) statistics, for each observation in the Facets Residualfile=,
"expected score for this response" - round this to the nearest category number = expected average category
if "expected average category" = "observed response as renumbered into a count of ordered steps" then MC = 1, else, MC = 0.
Compute average of MC for each observed category across all the relevant data for C->M
Compute average of MC for each expected category across all the relevant data for M->C
Example: The "Obs" (observed) is the original data. The "Stp" (step) is the ordinal version of the original data. This version is used for analysis, and is the version on which the "Exp" (expected) and the "Res" (residual) are based. This version may be the same as the original data, or the original data may be transformed either due to explicit instructions by the analyst, or by default operation of Facets.
For instance, suppose that the original data are observations of these three values: 10, 20 and 30. Then, by default, Facets will analyze these observations as the "steps": 10, 11, 12. If the original data are intended to be 10,11,12,13,14,....,28,29,30. Then please specify this is in your Models= statement:
?,?,..., R30K ; where "K" means "Keep" the original numeration.
