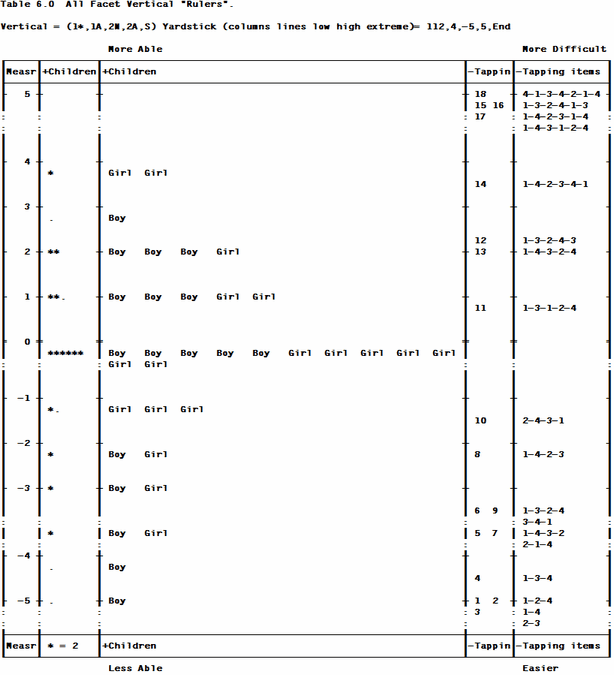
The Knox Cube Test measures short term memory (BTD p.28). There are two facets, Children and Tapping Items. Observations are scored as dichotomies, 1 for correct and 0 for incorrect.
Facets specifications and data (in file Kct.txt):
Title = Knox Cube Test (Best Test Design p.31) ; the report heading line
Facets = 2 ; two facets: children and items
Positive = 1 ; for facet 1, children, higher score = higher measure
Noncenter = 1 ; only facet 1, children, does not have mean measure set to zero
Pt-biserial = Yes ; report the point-biserial correlation
Vertical = 1*,1A,2N,2A ; show children by distribution and gender (sex), taps by number and name
Yard = 112,4 ; Vertical rulers 112 columns wide, with 4 lines per logit
Model = ?,?,D ; elements of the two facets interact to produce dichotomous responses
; log(Pni1/Pni0) = Bn - Di
; Bn = ability of child n, Di = Difficulty of item i,
; Pni1 = probability that child n on item i is scored 1.
Labels =
1,Children ; Children are facet 1
1-17 = Boy,,1 ; Pretend boys, in group 1, are numbered 1 through 17.
18-35 = Girl,,2 ; Pretend girls, in group 2, are numbered 18 through 35.
* ; end of child labels for facet 1
2,Tapping items ; Items are facet 2
1 = 1-4 ; Items labelled by the order in which the four blocks are tapped
2 = 2-3
3 = 1-2-4
4 = 1-3-4
5 = 2-1-4
6 = 3-4-1
7 = 1-4-3-2
8 = 1-4-2-3
9 = 1-3-2-4
10= 2-4-3-1
11= 1-3-1-2-4
12= 1-3-2-4-3
13= 1-4-3-2-4
14= 1-4-2-3-4-1
15= 1-3-2-4-1-3
16= 1-4-2-3-1-4
17= 1-4-3-1-2-4
18= 4-1-3-4-2-1-4
* ; end of item labels
Glabels=
1,1,Boys ; Facet 1 Group 1 is Boys
1,2,Girls ; Facet 1 Group 2 is Girls
*
Data = ; no data file name, so data follows immediately in this file
1 ,1 ,1 ; child 1 on item 1 scored 1 (blanks are ignored)
1 ,2-18,1,1,1,1,1,1,0,0,0,0,0,0,0,0,0,0,0 ; child 1 on item 2 scored 1, on item 3 scored 1, etc to item 18
| ; 594 more observations, 18 per data line
35,1-18,1,1,1,0,0,0,0,0,0,0,0,0,0,0,0,0,0,0 ; child 35 scored 1 on items 1_3, 0 on items 4-18
Analysis of this data is initiated by:
C:\Facets> FACETS Kct.txt
Computation of linear measures from these data requires many iterations (passes through the data) until convergence is reached. Convergence occurs when each difference between the observed marginal (total) score and the corresponding expected score for each child, and also for each item, based on the current estimates of the measures, is negligibly small. Progress towards convergence is shown on screen.
During each pass through the data, a line is drawn across the screen:
>============================================<
This confirms that the program is running, and provides guidance as to how long an analysis is likely to take.
The output is written into file: KCT.OUT.txt. A useful table to examine initially to check for the success of the analysis is Table 6. Are the items positioned according to their difficulty in a way you would expect? Is the distribution of the children reasonable?

